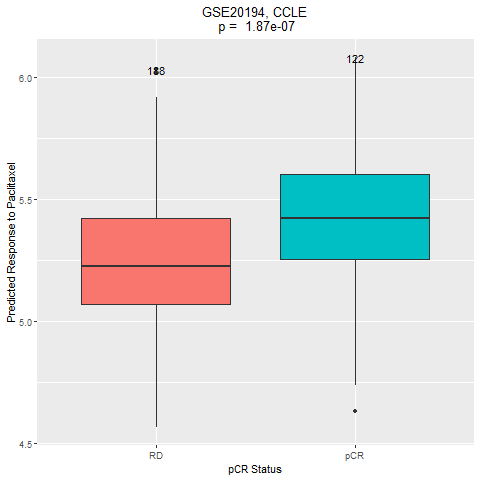
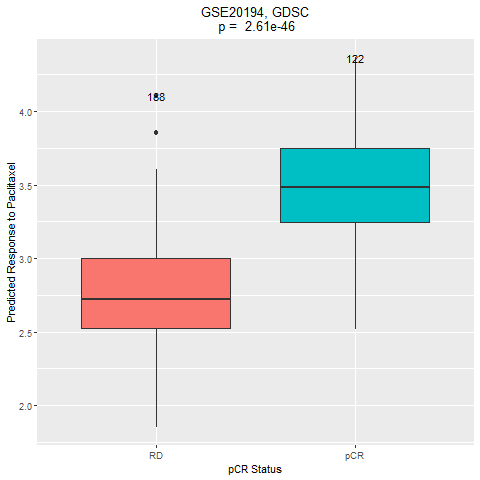
Run DrVAEN on dataset: GSE25055
1. Dataset summary
Neoadjuvant study of 310 HER2-negative breast cancer cases treated with taxane-anthracycline chemotherapy pre-operatively and endocrine therapy if ER-positive. Response was assessed at the end of neoadjuvant treatment and distant-relapse-free survival was followed for at least 3 years post-surgery.
2. Get and prepare dataset
The dataset can be accessed using the code:
#setwd("/path/to/GSE25055") library("GEOquery") library("limma") library("preprocessCore") Sys.setlocale(category = "LC_ALL", locale = "us") ################################################################################################### # code chunk: GSE25055 ################################################################################################### gse <- getGEO("GSE25055", GSEMatrix = TRUE) exprs(gse[[1]]) -> datExpr0 normalize.quantiles(datExpr0) -> datExprLQ dimnames(datExprLQ) = dimnames(datExpr0) ########## anno gpl = getGEO("GPL96") Table(gpl) -> anno grep("/", anno[,11]) -> check anno = anno[-check,] anno = anno[anno[,11]!="", ] datExprLQ = datExprLQ[which(rownames(datExprLQ) %in% anno[,1]),] match(rownames(datExprLQ), anno[,1]) -> ii symbol = anno[ii, 11] apply(datExprLQ, 2, function(u)tapply(u, symbol, median)) -> expr.mat grep("^RPS", rownames(expr.mat)) -> ii.1 grep("^RPL", rownames(expr.mat)) -> ii.2 expr.mat = expr.mat[-c(ii.1, ii.2),] write.table(format(expr.mat, digits=4),file="GSE25055.Expr.tsv", row.names=T, quote=F, sep="\t") pData(gse[[1]]) -> pheno.anno save(expr.mat, pheno.anno, file="GSE25055.RData")
The genes will be mapped to our backend gene list that are used for drug response prediction. The full gene list is here
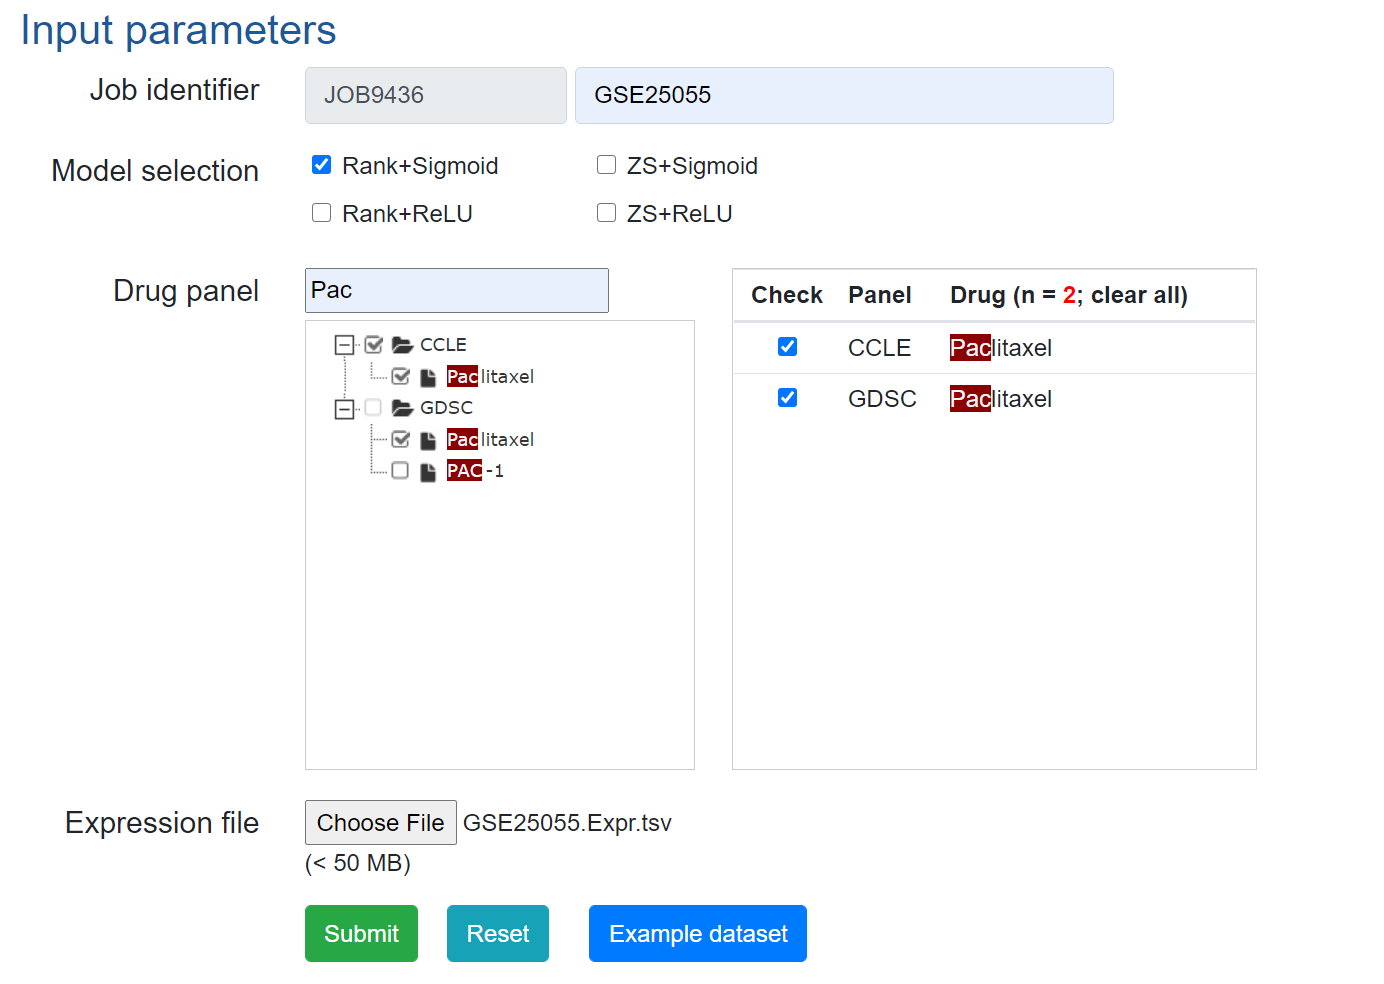
3. Predict drug responses using DrVAEN.
Once the gene expression matrix file is genereted, we can upload the file to DrVAEN to get the predicted drug response data.

Then download the predicted responses for further analysis.
4. Further analysis: Compare the drug responses between the two groups (pCR vs RD).
Here we present the example codes for the analysis.
library(glmnet) load("GSE25055.RData") ## CCLE drug_response = read.table("ranksigmoid_CCLE.pred.txt", as.is=T, header=T) ### all dat = data.frame(cbind(Response = drug_response[, "Paclitaxel"], pCR=pheno.anno[,"characteristics_ch1.21"])) dat[,1] = as.numeric(as.character(dat[,1])) t.test(dat[,1] ~ dat[,2]) dat[which(dat[,2]=="dlda30_prediction: pCR"),2] = "pCR" dat[which(dat[,2]=="dlda30_prediction: RD"),2] = "RD" dat[,2] <- factor(dat[,2], levels = c("RD", "pCR")) pvalue = t.test(dat[,1] ~ dat[,2])$p.value ##### plot library("ggplot2") give.n <- function(x){ return(c(y = max(x), label = length(x))) } p1 = ggplot(dat, aes(x=pCR, y=Response, fill=pCR)) + geom_boxplot() + labs(title=paste("GSE20194, CCLE\n", "p = ", format(pvalue, digits=3)), x="pCR Status", y = "Predicted Response to Paclitaxel") + theme(legend.position = "none", plot.title = element_text(hjust=0.5)) + stat_summary(fun.data = give.n, geom = "text") png("CCLE.png") print(p1) dev.off() ## To analyse the predicted drug response data from GDSC model, please just change "CCLE" to "GDSC" in the above codes.

