1. Introduction
Drug response in patients has been a long-term challenge due to genetics, environment, and disease-specific heterogeneity. In this website, we implement our recently published method, VAEN, to impute drug response based on base-line transcriptome data. VAEN consists of a deep variational autoencoder (VAE) model and an Elastic net regression model and has been rigorously validated using cross-validation, multiple replications, and cross-panel evaluation. Because the models were built on baseline gene expression profile, they are widely applicable. We refer this webserver as DrVAEN while the original algorithm as VAEN.
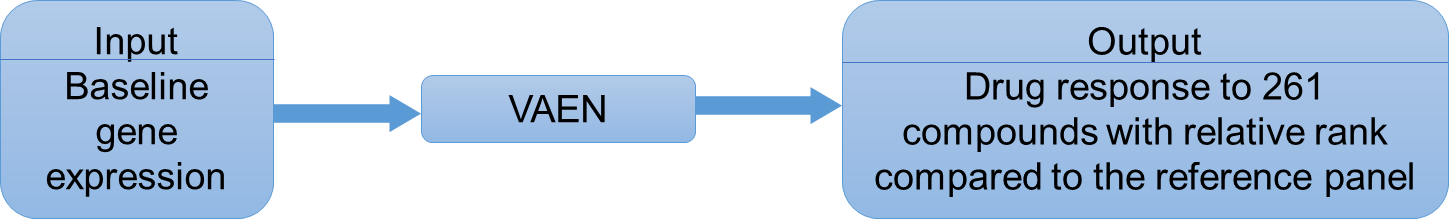
Figure 1. inputs and outputs of DrVAEN.
2. Model
2.1. Compounds
VAEN models have been trained for 24 anti-cancer compounds from CCLE (https://portals.broadinstitute.org/ccle) and 251 compounds from the GDSC project (Release 7.0, version 17.3, access date: 8/29/2018). The full list of compounds can be found here.
2.2. Models
During the training process, we explored different ways of preprocessing the input expression data:
- Rank-based inverse normal transformation (Rank)
- Z-score normalization of all genes for each sample (ZS)
We also explored different activation functions in VAE: (1) Sigmoid or (2) ReLU. In addition, we compared the VAEN models with the standard PCA method to compress the gene expression data before EN. Thus, there are a total of five models available in our website, including four variations of VAEN models using different combinations of the normalization methods (Rank, ZS) and two activation functions (Sigmoid and ReLU).
2.3. Model performance
As demonstrated in our paper, for the majority of drugs and compounds, the model with rank-based inverse normal transformation companied with Sigmoid activation had the best overall performance. Thus, we highly suggest users to select this model in general. However, it should also be noticed that, for few drugs/compounds, the best model may be other combinations of the model. A performance comparison is listed below. In our website, we report all models for users’ information. You may always select the VAEN (Rank + Sigmoid) model while also check for the performance table.
3. Webserver workflow
DrVAEN provides user-friendly interface for users to submit jobs, check job status, and retrieve results.
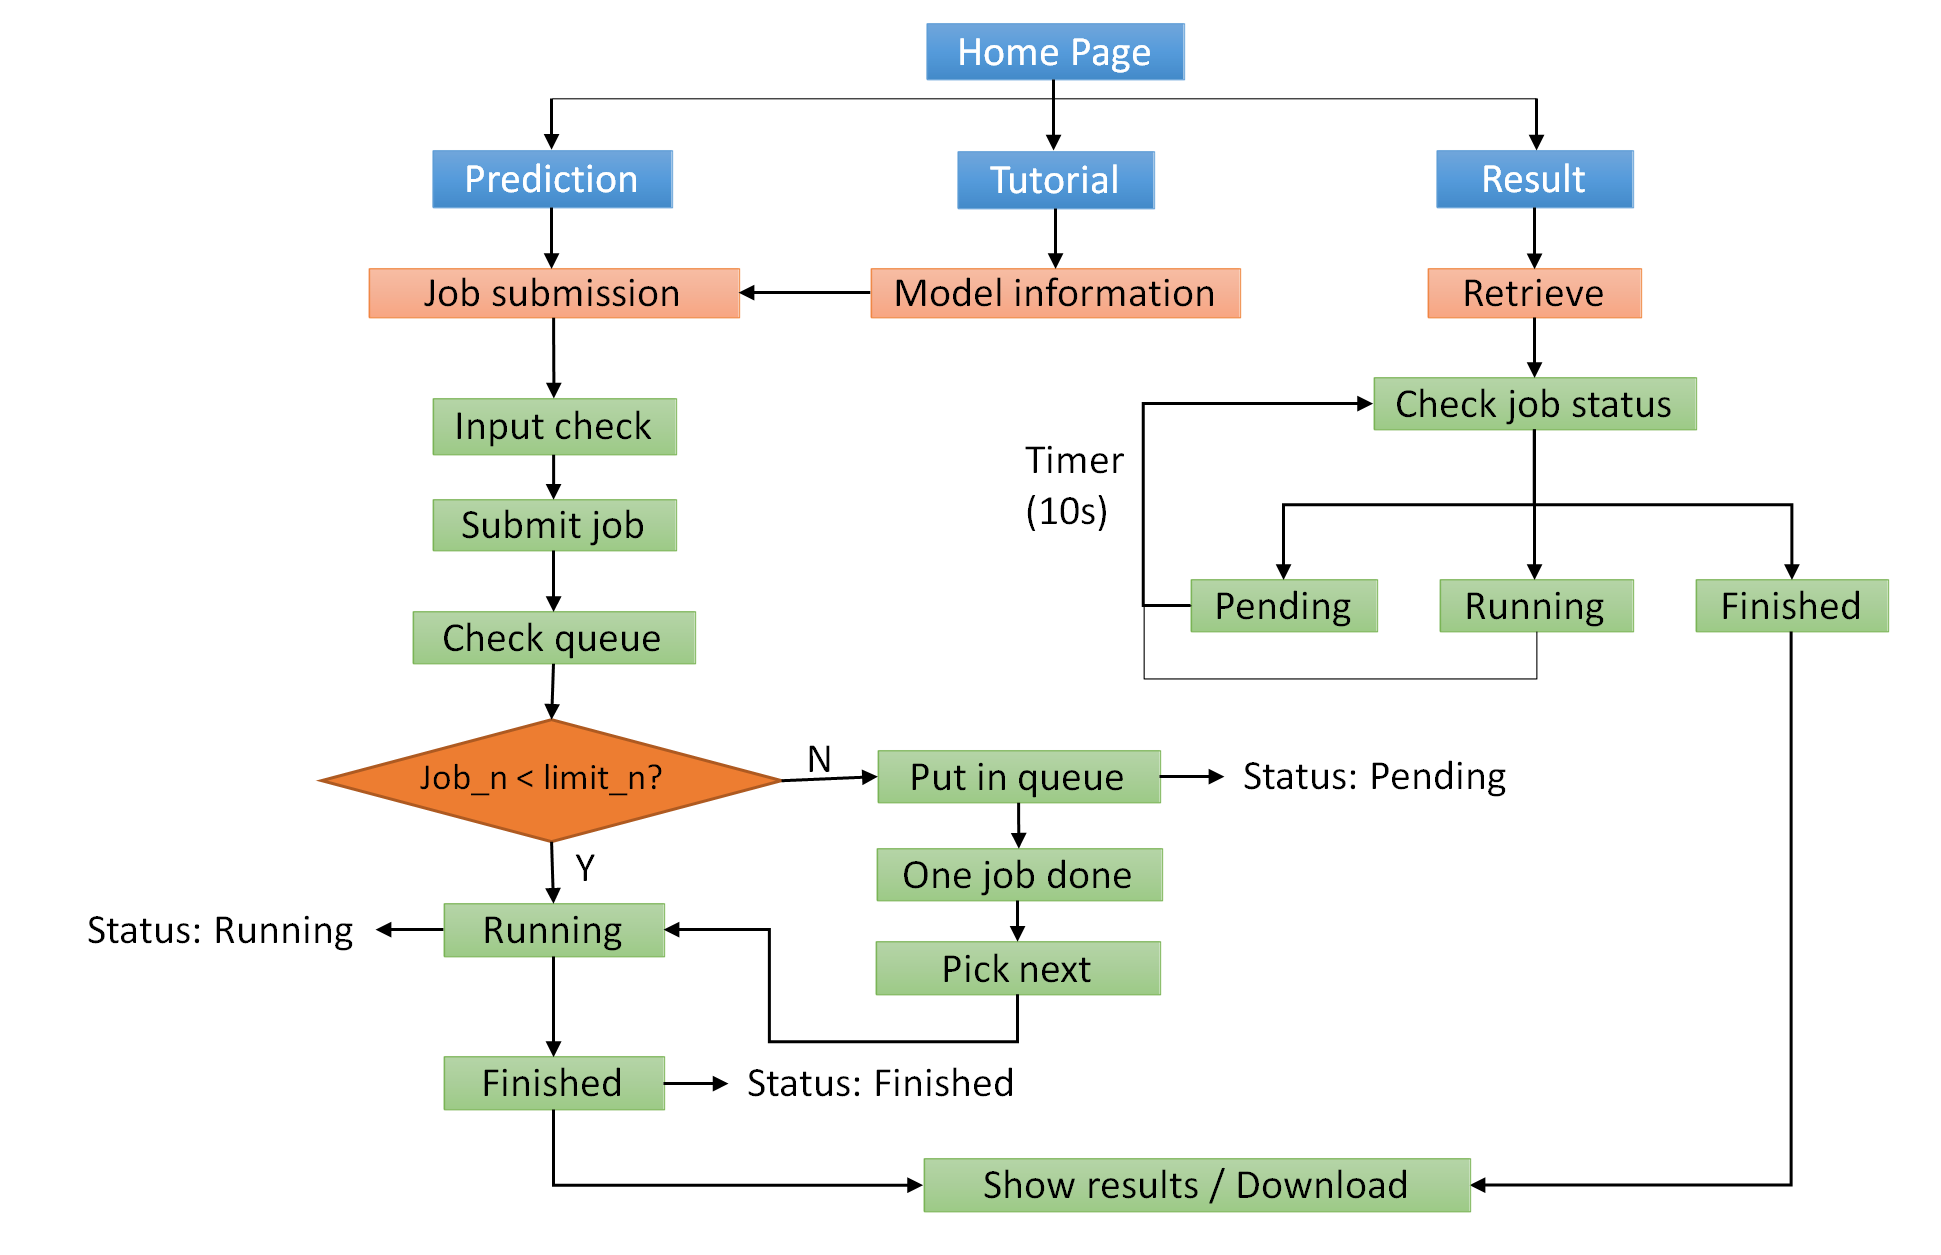
Figure 2. Workflow of the webserver.
3.1. Input
For each job, we assign a JobID, which can be automatically generated or created by the users.
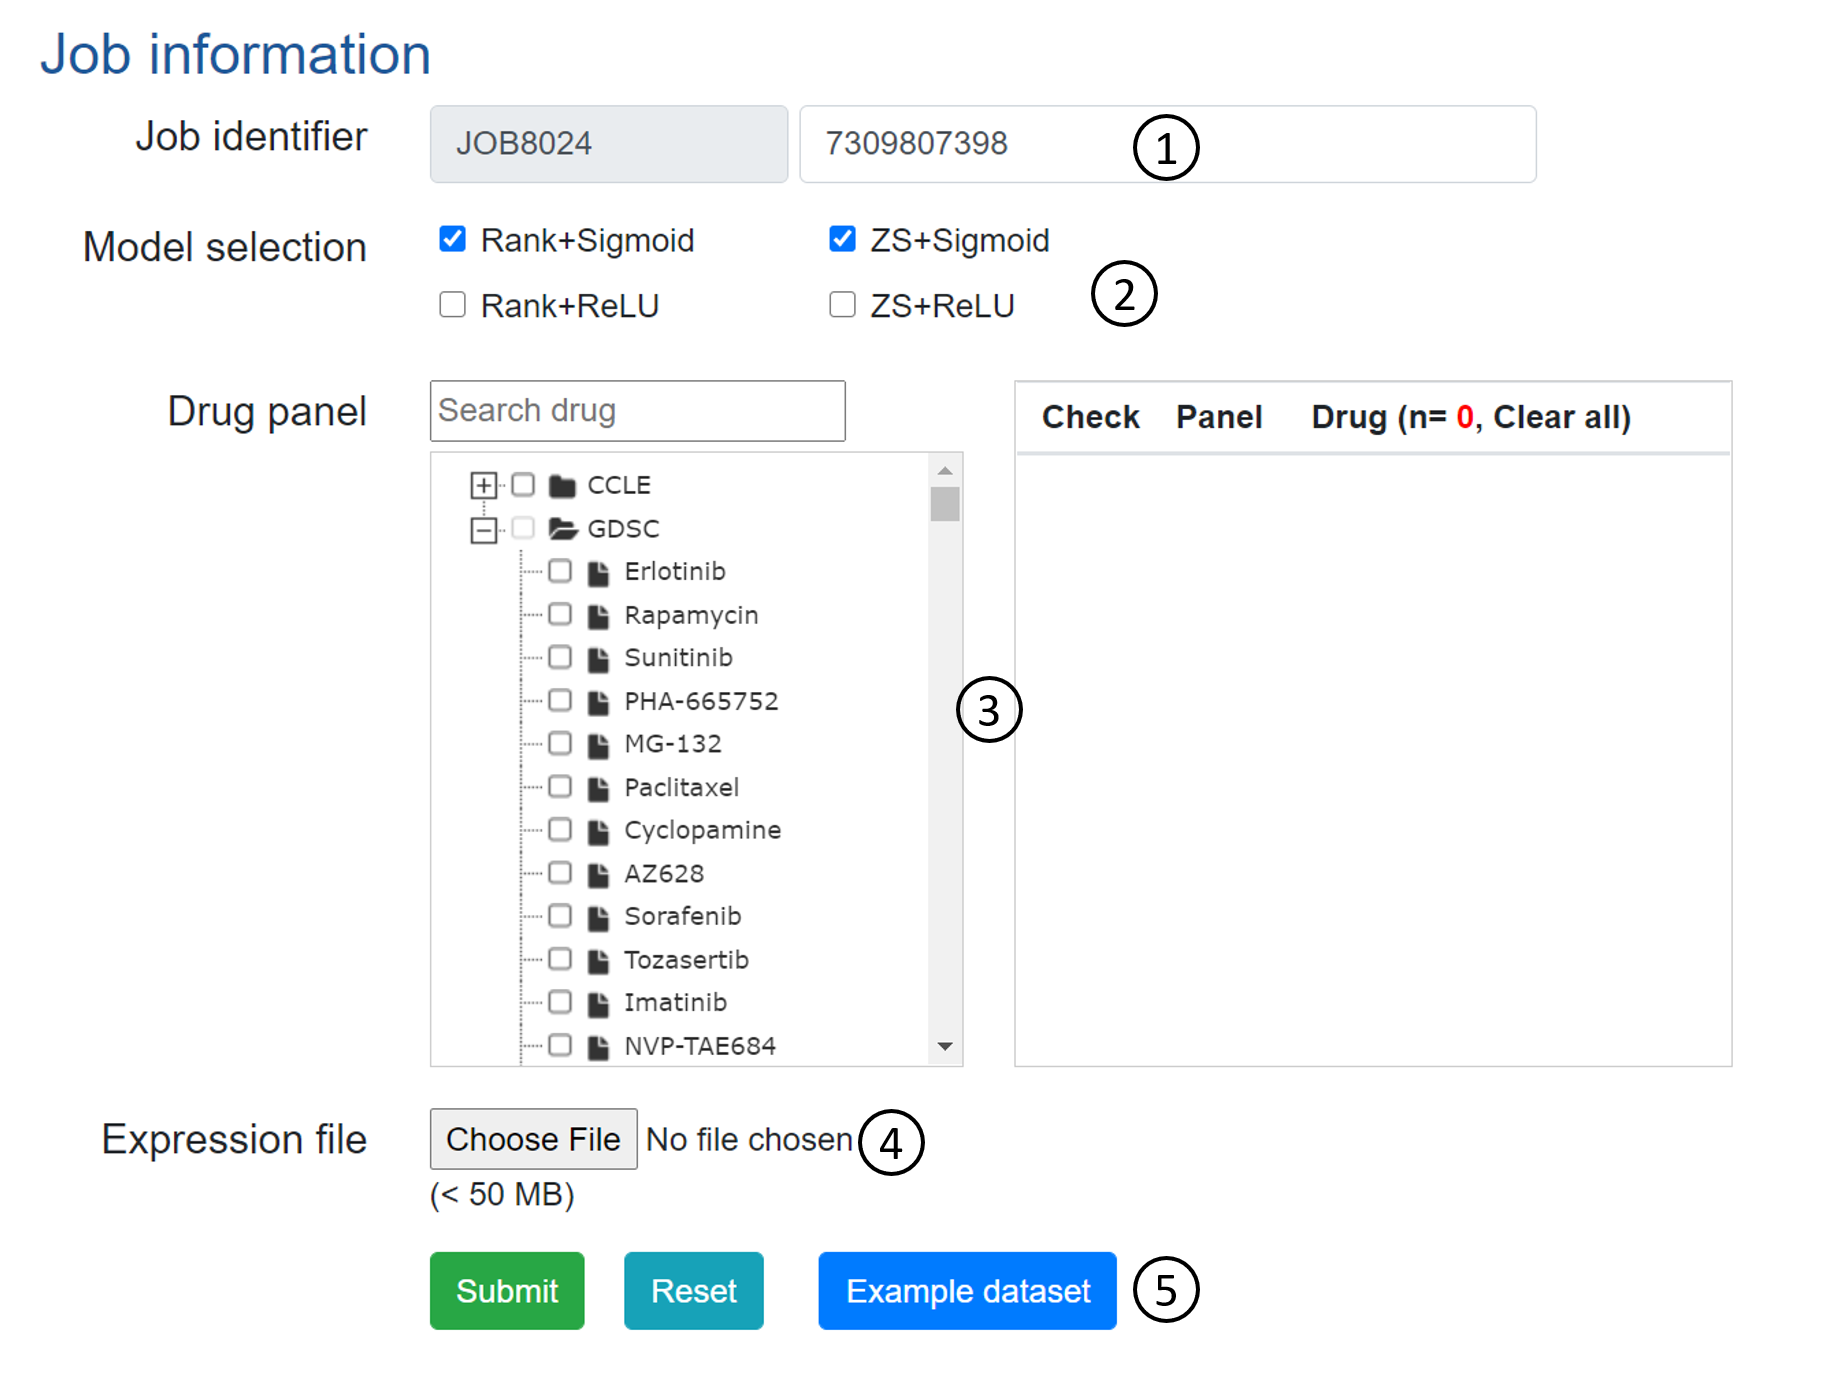
Figure 4. Job submission form.
- Job identifier: Job identifier can be generated automatically or customized by the submitter. It is confidential to other users and can be used for job status monitoring and result retrieval.(See Results page).It is required.
- Model selection: DrVAEN supports 5 backend-VAE models for expression data representation. As aforementioned, Rank+Sigmoid is a safe selection though you may also check for other models for comparison.
- Drug panel: There are 24 drugs in CCLE panel and 251 drugs in GDSC panel (14 drugs are shared by both CCLE and GDSC). We have set a limitation on the total number of selected compounds to 50. For each job, users can submit up to 50 drugs. It will take up to 10 minutes to finish.
- Expression file: An expression file must be uploaded. The file should be in TSV format with genes in rows and samples in columns. For genes, we support Gene symbols, NCBI gene IDs, and Ensembl IDs (e.g., ENSG00000123091. No dot suffix). Please refer to the example dataset.
Example format:sample1 sample2 ...... sampleN Gene1 Gene2 ...... GeneX
3.2. Output
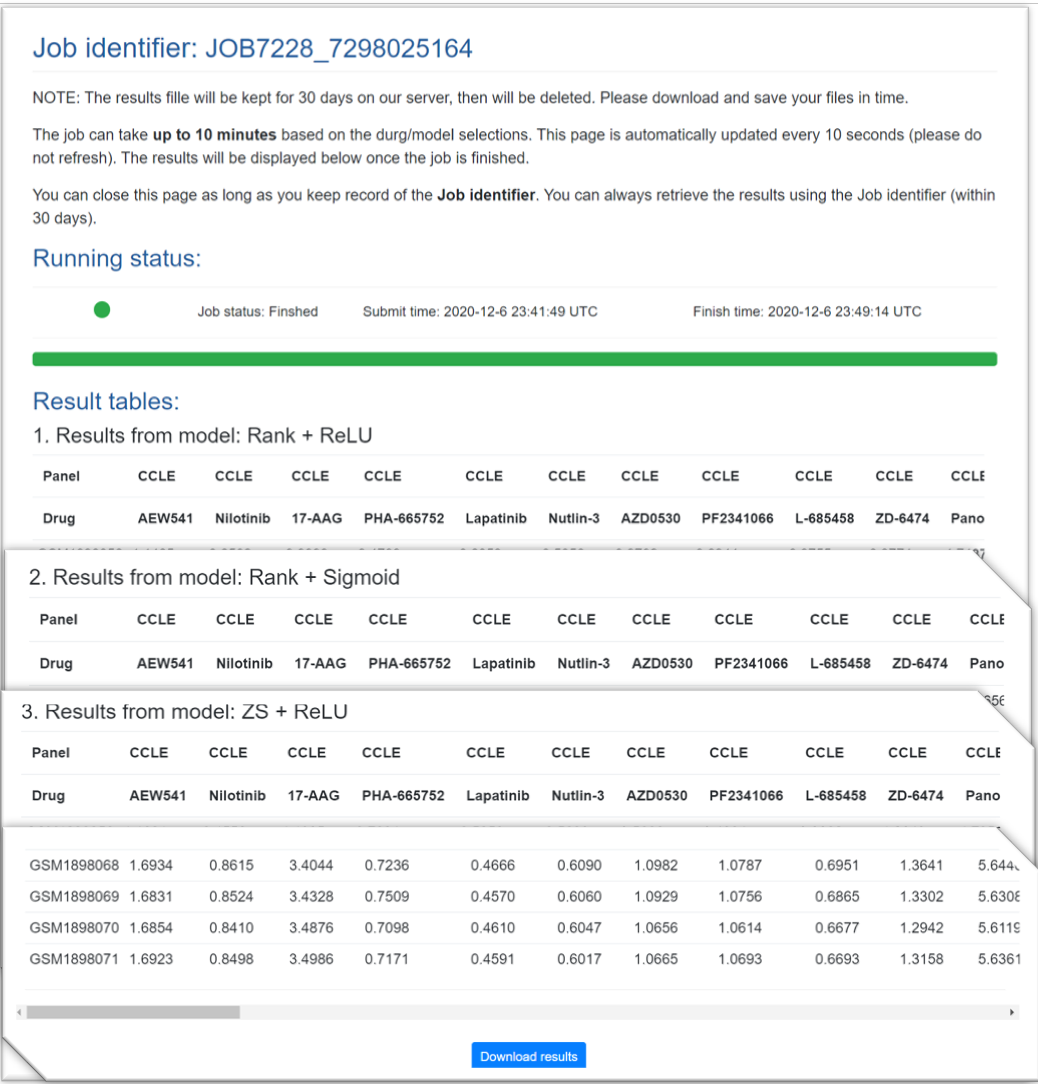
(1) Predicted drug response velues
For each selected model, DrVAEN will generate a data table to show the predicted drug response values for all submitted drugs. Of note, in CCLE, we used ActArea as the measurement of drug response. ActArea had a negative relationship with IC50 (i.e., a low IC50 means a high ActArea and high sensitivity). In GDSC, we used –LN(IC50) as the measurement of drug response and, thus, the predicted values had the same trend as ActArea, i.e., a high predicted value indicates a high sensitivity.
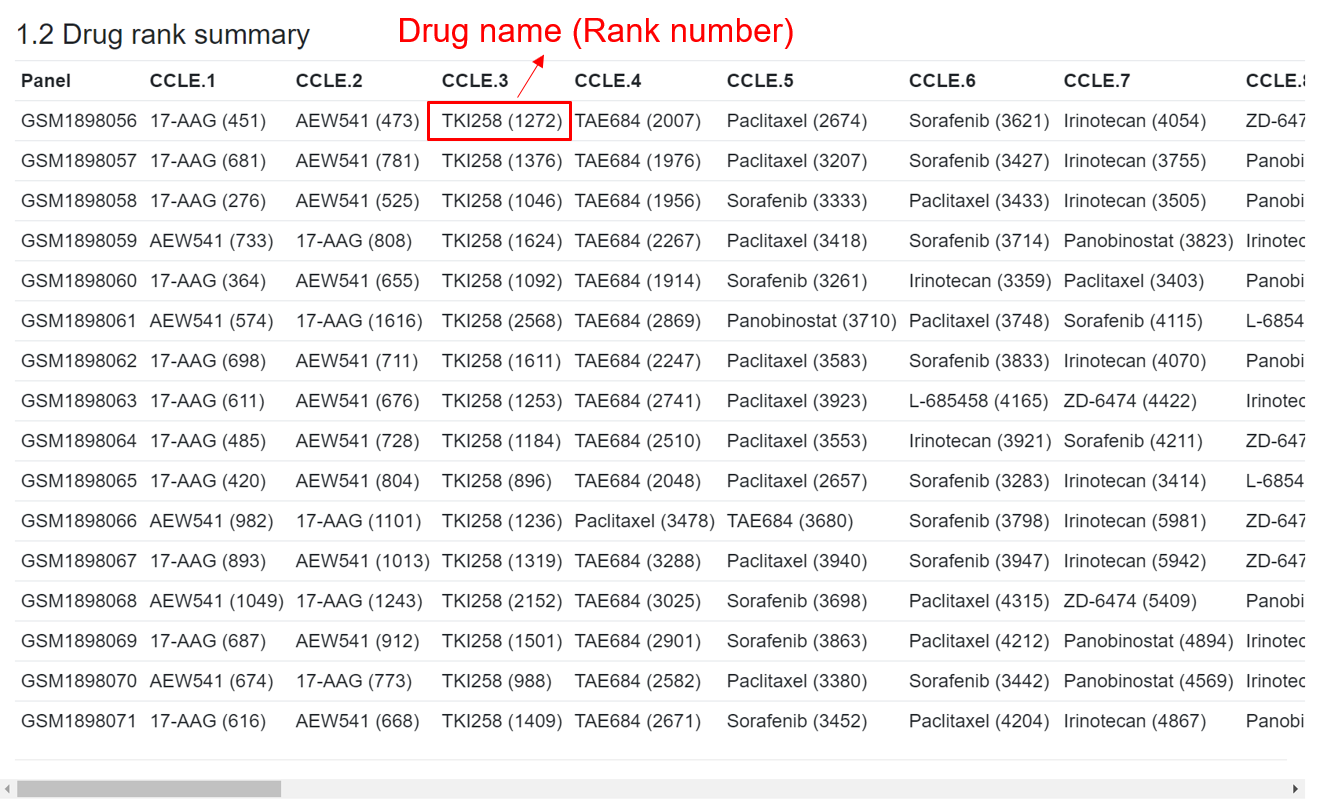
(2) Drug rank summary table
For each sample in the expression file, the predicted response value for each drug is compared with the predicted drug response data for TCGA pan-cancer samples (10459 samples across 33 cancer types). The rank of the user-input drugs in each sample was calculated as compared to all 10459 TCGA samples. For each drug, a lower rank number indicates the sample receives higher drug response (higher sensitivity). This table shows the sorted drugs in each sample based the rank.
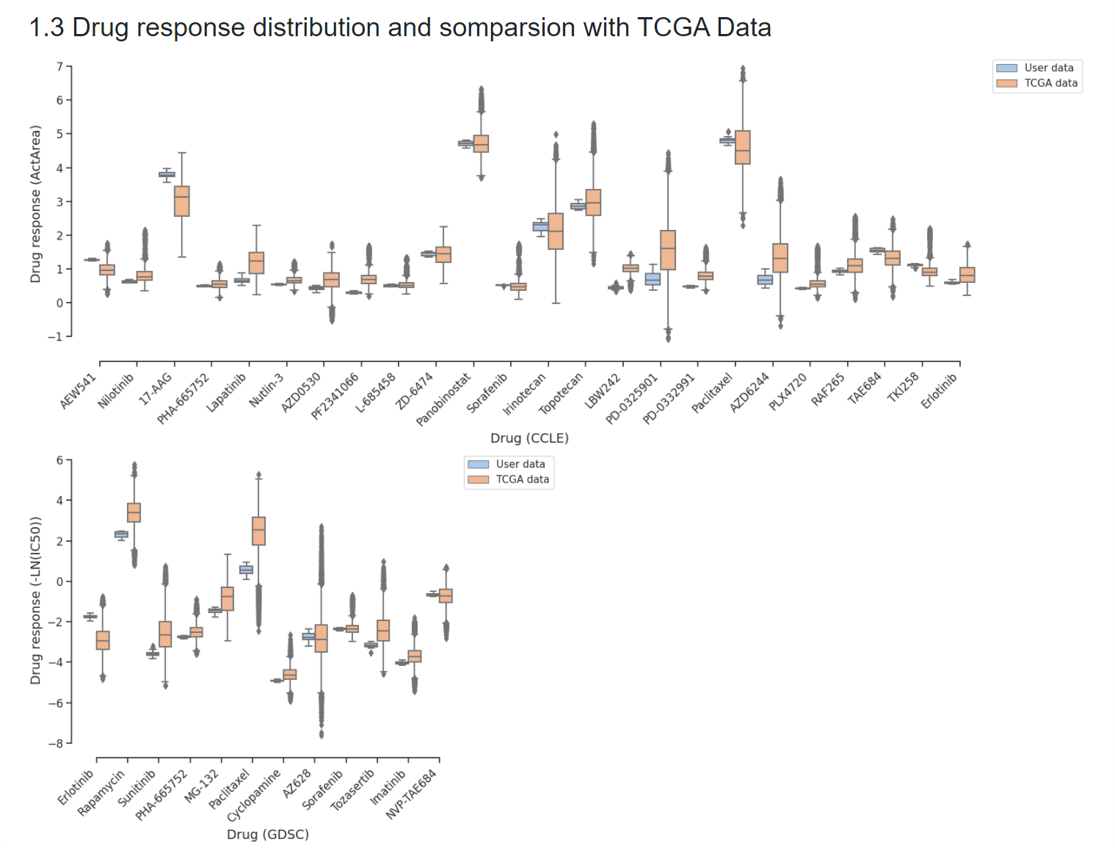
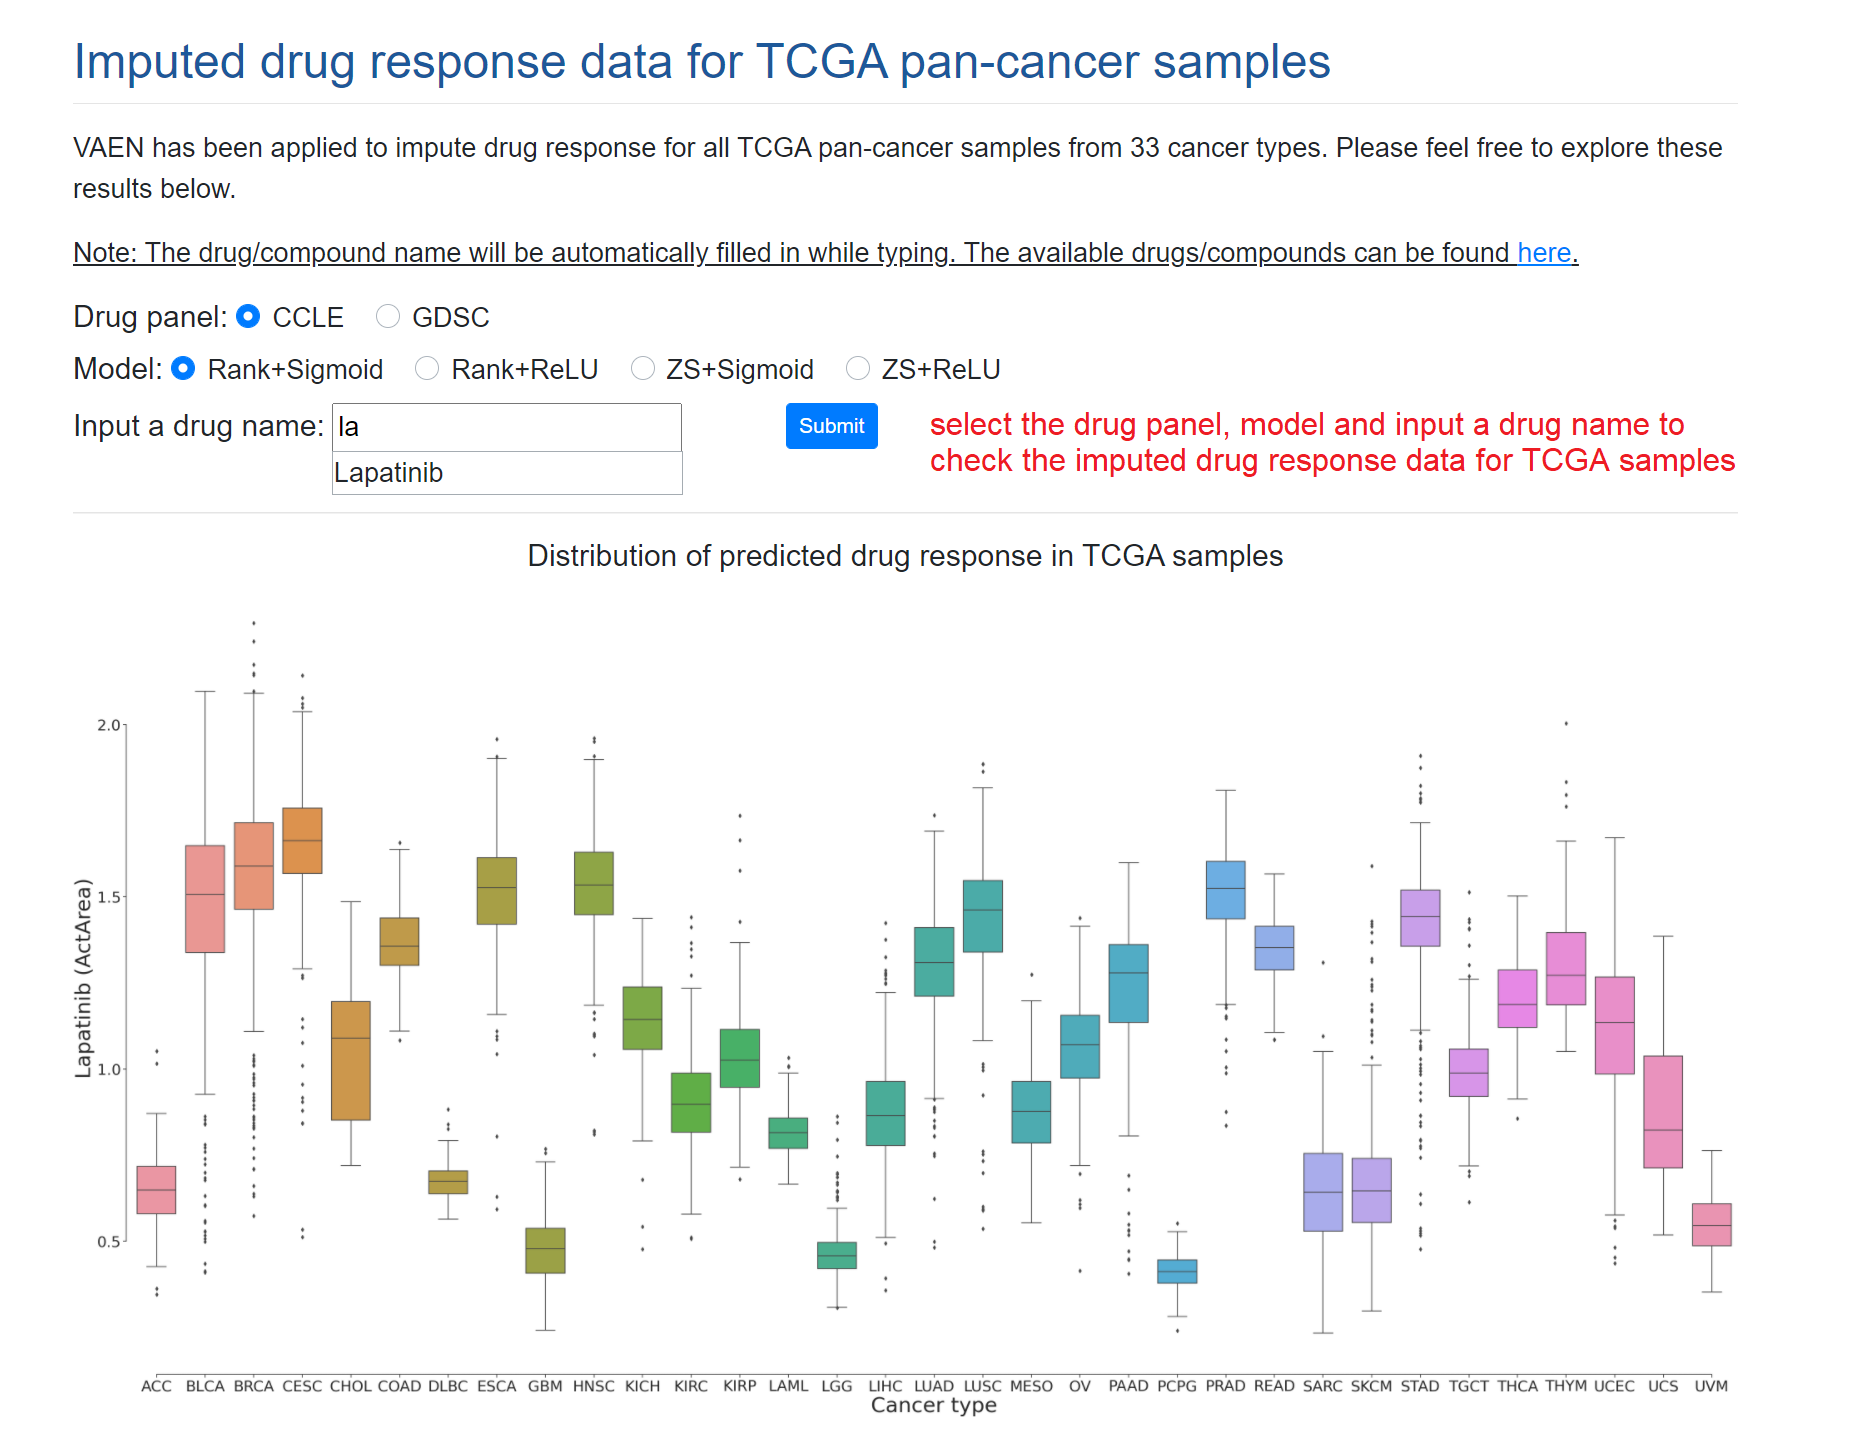
(3) Drug response distribution and comparison with TCGA Data
The distributions of the predicted drug response for user submitted data and TCGA data will be displayed as boxplots. Users can compare their drug response results with the predicted drug responses for TCGA pan-cancer samples (all cancer types are shown in one box, for the drug response distribution in each cancer type, you can check them in our designed function DrTCGA).
At the page bottom, a “download” button is provided for downloading all the results.
3.3. Results retrieval
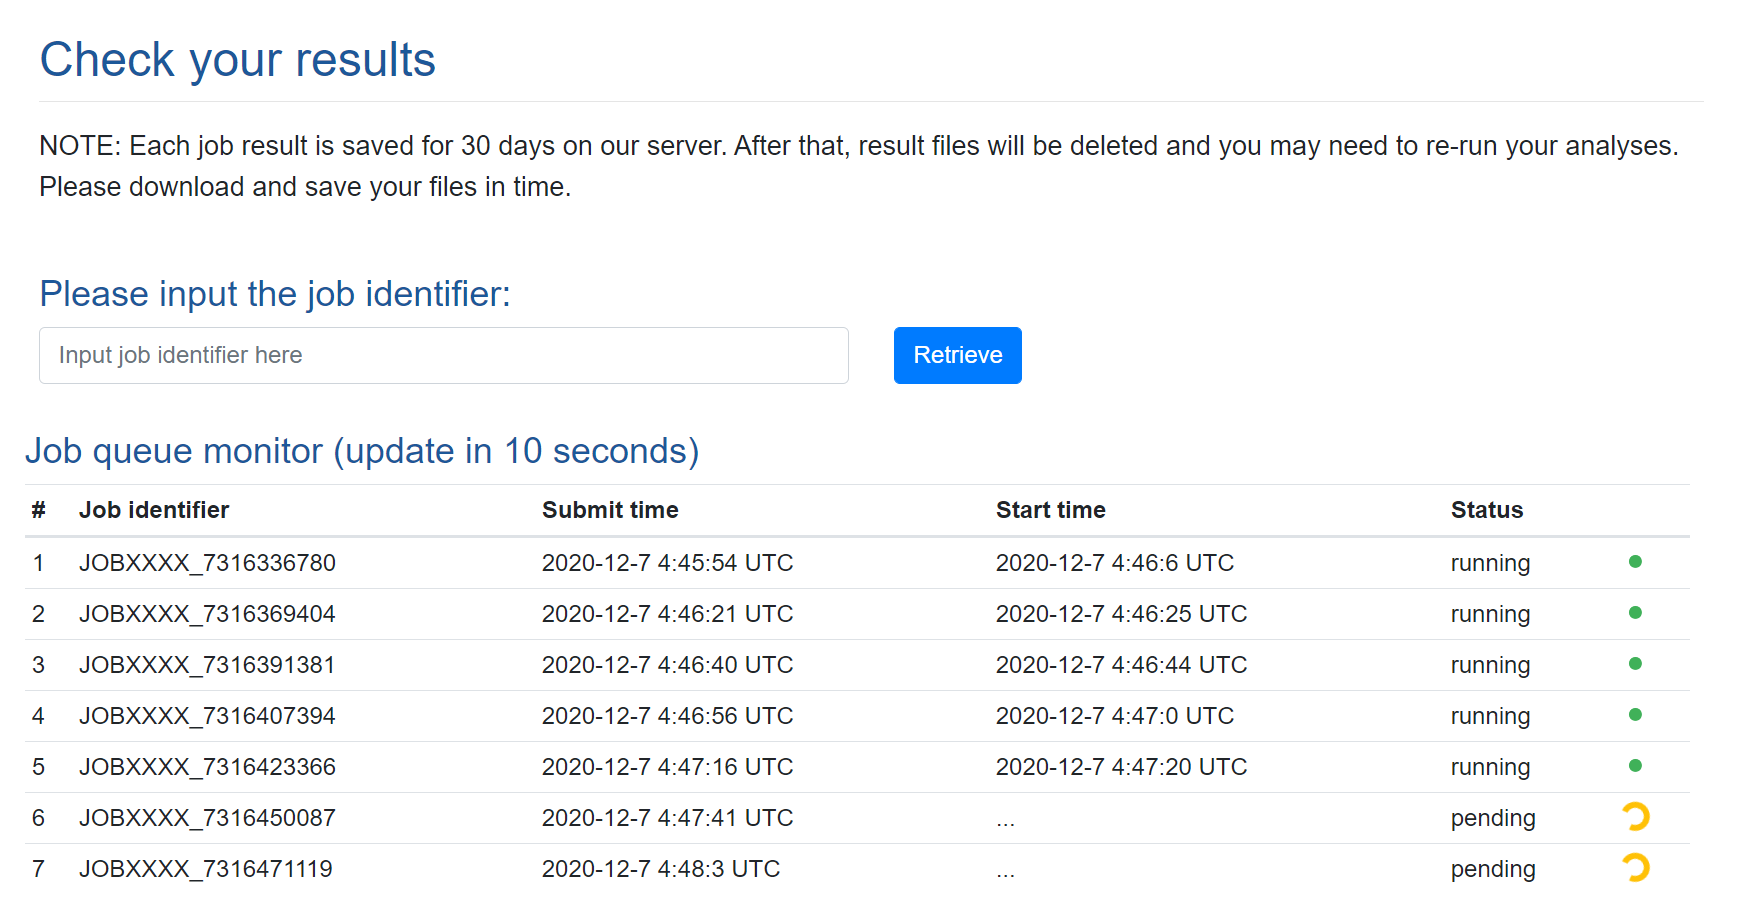
Job queue. DrVAEN implements a queue mechanism. Our DrVAEN webserver can run five jobs at the same time (note: each job can contain multiple samples). When a new job is submitted, if there are less than 5 jobs running, the newly submitted job will be ran directly with a "Running" status. Otherwise, the new job will be put into the waitlist with a "Pending" status. Once a job is finished, DrVAEN will check the queue and pick the next job to run until the waitlist is empty. The results page allows users to monitor the job queue and check their own job status by retrieving their job ID. The job ID is partially masked for a confidential purpose.
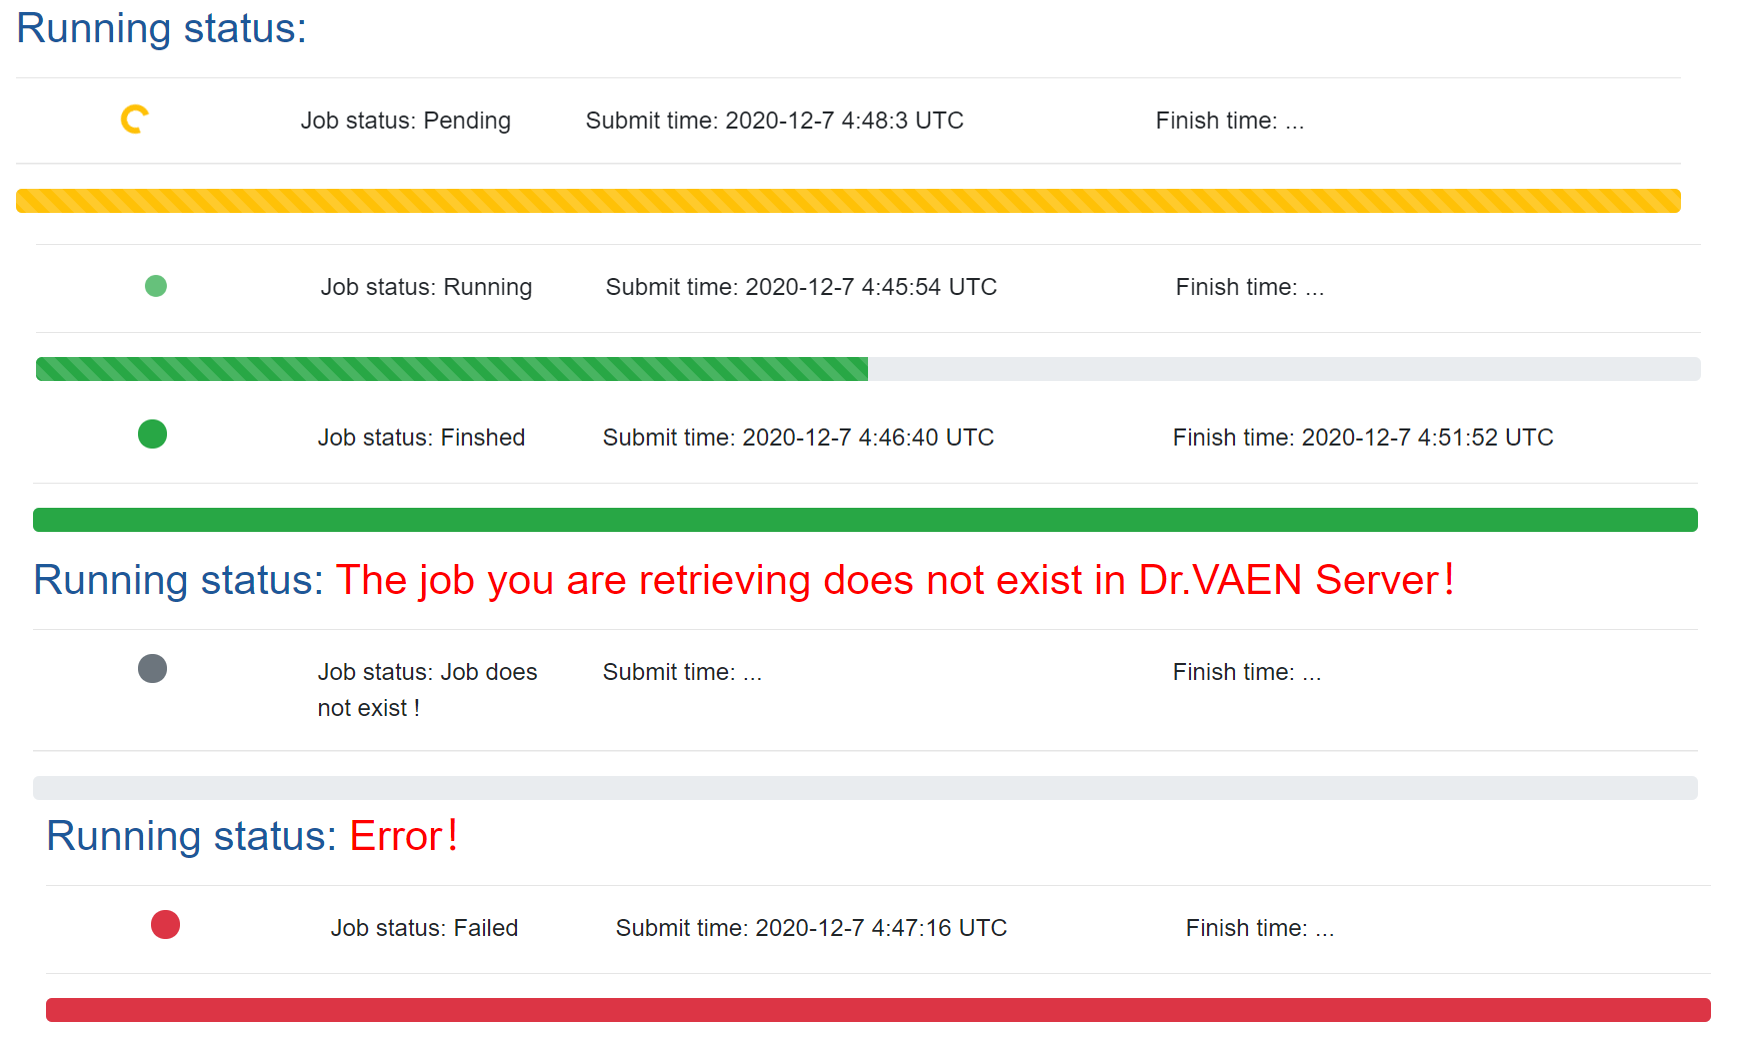
Job status. We used different color schemes to present the job status.
4. Drug response in TCGA
We have applied VAEN in all TCGA pan-cancer samples for ~10 000 cancer samples from 33 cancer types. Users may explore these results in DrTCGA page. The drug/compound name will be automatically searched and listed after you type at least two letters. If there is no drug name listed, it means our DrVAEN did not support the inputed drug name.
5. Examples
(1) Example with 16 samples(GSE73571): Check example Download dataset
(2) Example with only 1 sample: Check example Download dataset
(3) Example with 2 samples: Check example Download dataset
(4) Bad example with too few genes: Check example Download dataset
6. How to cite
Please cite:
Peilin Jia#, Ruifeng Hu#, Zhongming Zhao*. DrVAEN: Drug response prediction through deep Variational Autoencoder model followed by Elastic Net. Web site: https://bioinfo.uth.edu/drvaen
Peilin Jia, Ruifeng Hu, Guangsheng Pei, Yulin Dai, Yinying Wang, Zhongming Zhao(2021), Deep generative neural network for accurate drug response imputation. Nature Communications, 12:1740. PubMed