Application of DrVAEN in a melanoma dataset (GEO ID: GSE65185)
1. Dataset summary
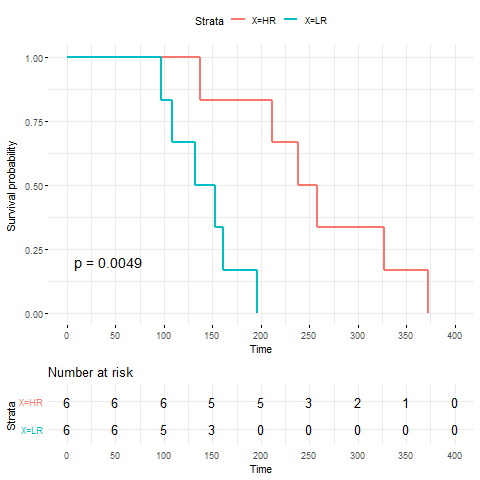
The original data includes a large-scale comparative analysis of temporal transcriptomes from melanoma patient-matched tumor biopsies. We used the baseline expression data and predicted their response to PLX4720, a potent inhibitor of BRAF V600E. We compared the survival status of samples stratified by their predicted response to PLX4720.
2. Get and prepare dataset
The original gene expression data can be downloaded from GEO. Users may follow the code in GitHub to preprocess the data, including ID mapping and dealing with genes with multiple probe sets.
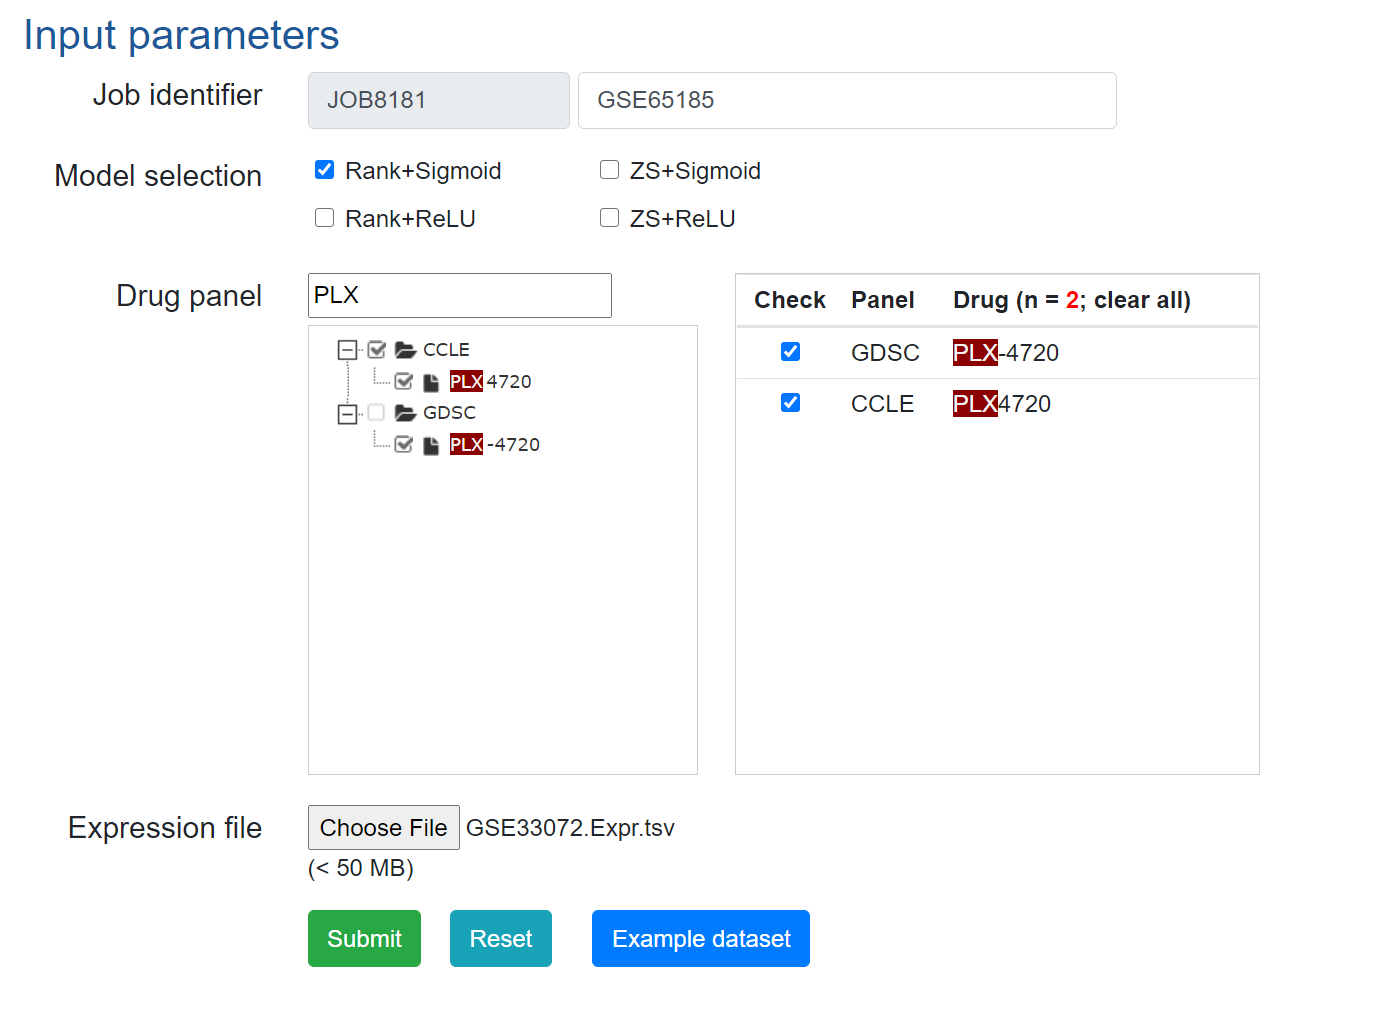
3. Predict drug responses using DrVAEN.
Example input parameters can be found below.
4. Survival analysis using the drug response data and survival data.
The patient survival data is available here