Gene Page: NR2E3
Summary ?
| GeneID | 10002 |
| Symbol | NR2E3 |
| Synonyms | ESCS|PNR|RNR|RP37|rd7 |
| Description | nuclear receptor subfamily 2 group E member 3 |
| Reference | MIM:604485|HGNC:HGNC:7974|Ensembl:ENSG00000278570|HPRD:05132|Vega:OTTHUMG00000172841 |
| Gene type | protein-coding |
| Map location | 15q23 |
| Pascal p-value | 0.027 |
| TADA p-value | 7.19E-4 |
| Fetal beta | -0.426 |
| eGene | Cerebellar Hemisphere Myers' cis & trans |
| Support | CompositeSet |
Gene in Data Sources
| Gene set name | Method of gene set | Description | Info |
|---|---|---|---|
| CV:PGCnp | Genome-wide Association Study | GWAS | |
| DNM:Fromer_2014 | Whole Exome Sequencing analysis | This study reported a WES study of 623 schizophrenia trios, reporting DNMs using genomic DNA. |
Section I. Genetics and epigenetics annotation
 DNM table
| Gene | Chromosome | Position | Ref | Alt | Transcript | AA change | Mutation type | Sift | CG46 | Trait | Study |
|---|---|---|---|---|---|---|---|---|---|---|---|
| NR2E3 | chr15 | 72104389..72104396 | TCCCCCGG | T | NM_014249 NM_016346 | . . | frameshift frameshift | Schizophrenia | DNM:Fromer_2014 |
eQTL annotation
| SNP ID | Chromosome | Position | eGene | Gene Entrez ID | pvalue | qvalue | TSS distance | eQTL type |
|---|---|---|---|---|---|---|---|---|
| rs10994209 | chr10 | 61877705 | NR2E3 | 10002 | 0.1 | trans |
Section II. Transcriptome annotation
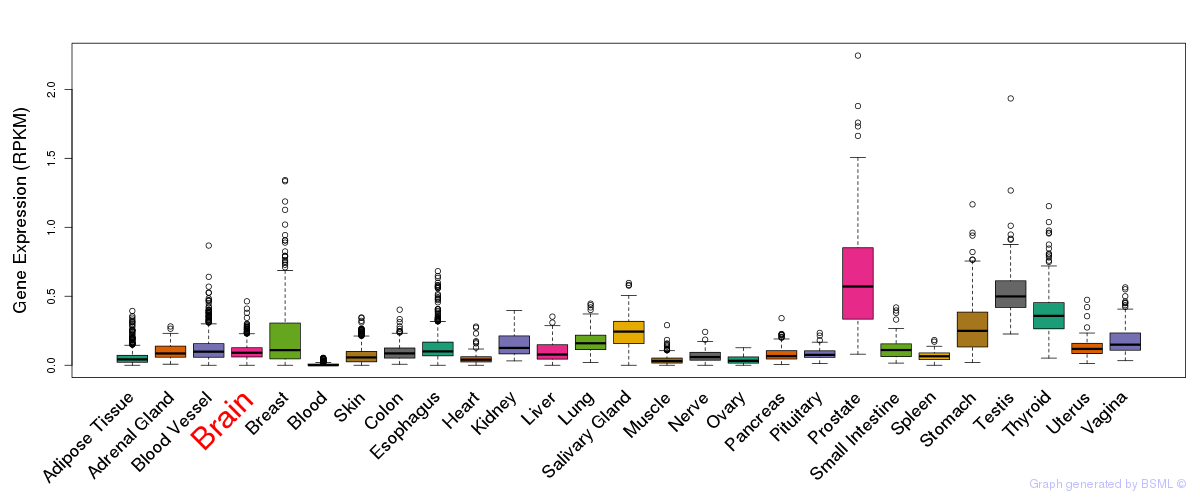
General gene expression (GTEx)
Gene expression during devlopment (BrainCloud)
Footnote:
A total of 269 time points ploted, with n=38 fetal samples (x=1:38). Each triangle represents one time point.
Gene expression of temporal and spatial changes (BrainSpan)
Footnote:
SC: sub-cortical regions; SM: sensory-motor regions; FC: frontal cortex; and TP: temporal-parietal cortex
ST1: fetal (13 - 26 postconception weeks), ST2: early infancy to late childhood (4 months to 11 years), and ST3: adolescence to adulthood (13 - 23 years)
The bar shown representes the lower 25% and upper 25% of the expression distribution.
Top co-expressed genes in brain regions
| Top 10 positively co-expressed genes | ||
| Gene | Pearson's Correlation | Spearman's Correlation |
| MCM3AP | 0.93 | 0.93 |
| AGPAT6 | 0.93 | 0.95 |
| INTS3 | 0.93 | 0.95 |
| PCGF3 | 0.93 | 0.94 |
| FBXW2 | 0.93 | 0.94 |
| ZNF263 | 0.93 | 0.95 |
| RNPS1 | 0.93 | 0.94 |
| PRPF40B | 0.93 | 0.93 |
| NFX1 | 0.93 | 0.94 |
| IKBKAP | 0.93 | 0.94 |
| Top 10 negatively co-expressed genes | ||
| Gene | Pearson's Correlation | Spearman's Correlation |
| AF347015.31 | -0.87 | -0.91 |
| MT-CO2 | -0.85 | -0.91 |
| AF347015.27 | -0.85 | -0.90 |
| AF347015.33 | -0.83 | -0.87 |
| AF347015.8 | -0.82 | -0.90 |
| MT-CYB | -0.82 | -0.87 |
| AF347015.21 | -0.81 | -0.93 |
| FXYD1 | -0.80 | -0.86 |
| HIGD1B | -0.80 | -0.88 |
| AF347015.15 | -0.79 | -0.86 |
Section V. Pathway annotation
| Pathway name | Pathway size | # SZGR 2.0 genes in pathway | Info |
|---|---|---|---|
| REACTOME GENERIC TRANSCRIPTION PATHWAY | 352 | 181 | All SZGR 2.0 genes in this pathway |
| REACTOME NUCLEAR RECEPTOR TRANSCRIPTION PATHWAY | 49 | 36 | All SZGR 2.0 genes in this pathway |
| SCHLOSSER SERUM RESPONSE AUGMENTED BY MYC | 108 | 74 | All SZGR 2.0 genes in this pathway |
| SANSOM APC TARGETS UP | 126 | 84 | All SZGR 2.0 genes in this pathway |
| ZHENG BOUND BY FOXP3 | 491 | 310 | All SZGR 2.0 genes in this pathway |
| SANSOM APC TARGETS | 212 | 121 | All SZGR 2.0 genes in this pathway |
| BRUINS UVC RESPONSE VIA TP53 GROUP D | 280 | 158 | All SZGR 2.0 genes in this pathway |