We organized variants and genes by data sets. A data set is named as "data_type:study", where data_type is one of CV (common variants), CNV (copy number variants), DNM (de novo mutations), LK (linkage), DEG (differentially expressed genes), and DMG (differentially methylated genes) (see below). Study is mainly referred to by the first author's name followed by the publication year, e.g., "Zhao_2015". For a variant or gene, it can be tagged with multiple data sets. To browse the overall data sets, please visit the browse page. To browse a particular data set, please check the "Datasets" button in the header line.
To search for a variant or a gene of interest, please use the search page, where functions are provided to search by SNPs, genes, or regions.
The most often used pages are the SNP page and the GENE page (see description below).
| Data type (Label) | # publications reviewed | # data sets | # genes or variants | # significant genes | # samples |
|---|---|---|---|---|---|
| Common Variant (CV) | Manual curation over years | 6 | >900,000 SNPs (after imputation) nominal significance | 724 genes | |
| De Novo Mutation (DNM) | ~80 | 10 | >900 genes with DNMs | 274 genes significantly over-represented | >1680 trios and >800 case/control |
| Copy Number Variant (CNV) | 500 | 4 | 15 rare and replicated CNVs | 215 genes | |
| Differentially Expressed Gene (DEG) | >140 | 2 | 189 significant DEGs | 70 brain and ~800 blood | |
| Differentially Methylated Gene (DMG) | >60 | 5 | 4274 DMGs | 288 replicated in 2 or more studies | |
 Common Variants (CVs)
We have two tiers of SNPs. Both tiers are searchable, but only SNPs of Tier 1 are available through the browse page.
SNPs of Tier 1 set were collected from five independent resources: GWAS Catalog (CV:GWAScat), GWASdb, PheWAS, PGC2, and a multi-stage GWA study. These SNPs have strong evidence for their association with schizophrenia, in most cases reaching genome-wide significance. Raw records were remapped to the human reference genome hg19, if necessary. SNPs were then annotated systematically using the tool wANNOVAR. Raw records were displayed in the SNP page and the gene page in the same way as they were originally obtained.
SNPs of Tier 2 set were collected from the PGC2 summary results, with a nominal p-value <0.05.
De
novo mutations (DNMs)
De novo mutations were collected from ten whole exome sequencing projects and one study with targeted sequencing. Please see here for details.
DNMs were mapped to genes. A gene-level p-value was also calculated using the program TADA to evaluate the likelihood of the gene being contributive to the investigated disorder.
Differentially
Expressed Genes (DEGs) and brain expression data
Differentially Expressed Genes were collected from two studies. We reviewed a list of > 100 publications by searching in PubMed. Please see here for details.
The four brain expression data, used for annotation and interpretation of genes and variants, were collected with unique and complementary features. Each of them focuses on expression changes of brain transcriptome during aging (from fetal to >80 years old), hundreds of transcriptome in deep layers of brain areas, spatiotemporal expression changes, and a multiple tissue expression data set.
Differentially
Methylated Genes (DMGs) and brain methylation QTL (meQTL) data
Differentially Methylation Genes were collected from multiple studies. We searched in PubMed using the keywords "schizophrenia AND methylation AND genome-wide". For the >300 abstracts returned from this search, they were examined carefully and 10 studies were determined to be of large scale methylation comparison between schizophrenia patients and control. The studies with available data were collected. Please see here for details.
Candidate
genes studied in schizophrenia
We defined four keywords for schizophrenia, and searched in PubMed for RefSeq genes that were co-mentioned in the title ([TI] or the abstract [AB]. Genes with special characters were manually removed, such as "OK/SW-CL.36", "16S rRNA", "12S rRNA", "OK/SW-CL.58", "IV", "S11", "S7", "S12", "CHR", "JUN", "BAD", "AN", "LARGE", "IMPACT", "T", "MICE", "SET", "HT", "MET", "ACT", "MS", "ECT", "HR", "NM", "REST", "CA1", "SHE", "COPE", "TH", "SF", "COMA", "BED", "CA2", and "CA3". More than 3000 genes were collected in this category. In the gene page, such information is listed.
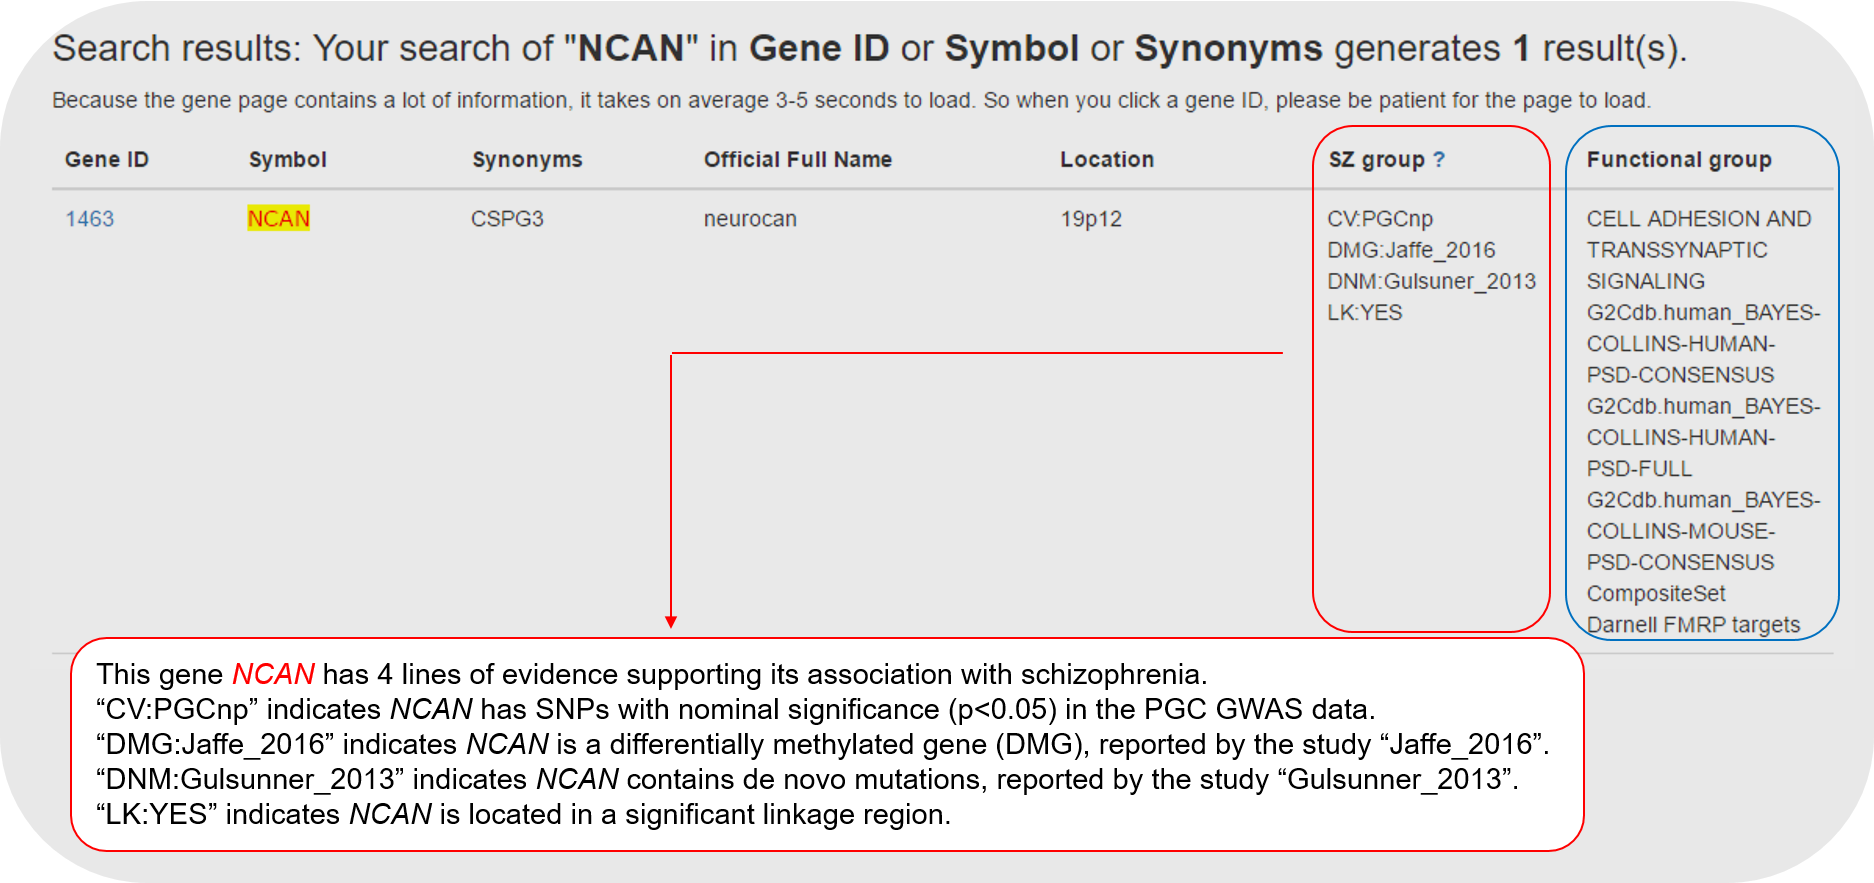
![]() To search for a gene, please use the gene symbol or gene ID. A list of genes whose symbols contain the query string will be listed. For example, searching using "AKT" will lead to AKT1, AKT2, and AKT3. A brief illustration of the resultant page is shown below.
To search for a gene, please use the gene symbol or gene ID. A list of genes whose symbols contain the query string will be listed. For example, searching using "AKT" will lead to AKT1, AKT2, and AKT3. A brief illustration of the resultant page is shown below.
![]() To search for SNPs, you may use the function to search directly using the rs ID (if you know the ID). This will lead to the SNP page (see section "4. Illustration of the SNP page" below for illustration).
To search for SNPs, you may use the function to search directly using the rs ID (if you know the ID). This will lead to the SNP page (see section "4. Illustration of the SNP page" below for illustration).
![]() Alternatively, if the user only knows the genomic region where the SNP is listed, the function "search by region" can be applied.
Alternatively, if the user only knows the genomic region where the SNP is listed, the function "search by region" can be applied.
4. Illustration of the SNP page
The SNP page starts with a summary table of the SNP information. Following the summary table, additional annotation tables are presented, including eQTL (if the SNP is an eSNP in brain), meQTL (if the SNP is a meSNP in brain), enhancers (if there are any within 50kb of the SNP), and promoters (if any).
4.1 The summary table in the SNP page.
| SNP page header | Example value | Annotation |
|---|---|---|
| SNP ID | rs14403 | The link will lead to the page in NCBI |
| Chr. | chr1 | Genomic coordinate (hg19) |
| Position | 243663893 | Genomic coordinate (hg19) |
| A1 | T | |
| A2 | C | |
| P | 1.305E-7 | The p-value reported in the PGC summary file. |
| Beta | 0.935 | The beta value or odds ratio reported in the PGC summary file. |
| Func | UTR3 | Functional annotation obtained from wANNOVAR. |
| Gene | AKT3, | Residing genes or the nearest upstream/downstream genes. The link will lead to the corresponding gene page. |
| Distance | NM_005465:c.*4658A>G | For the SNPs in gene regions, further annotations of their amino acid changes are available. For the SNPs in the intergenic regions, the distance of each SNP to its upstream and downstream gene is shown. |
| Source | Dataset that the SNP was originally collected. | |
| eSNP | N | Whether the SNP is an eSNP in brain eQTL data. |
| meSNP | N | Whether the SNP is an eSNP in brain meQTL data. |
| In CNV | N | Whether the SNP is located in the CNV regions. |
| In Linkage | N | Whether the SNP is located in the linkage regions. |
4.2 The eQTL and meQTL information is listed as tables.
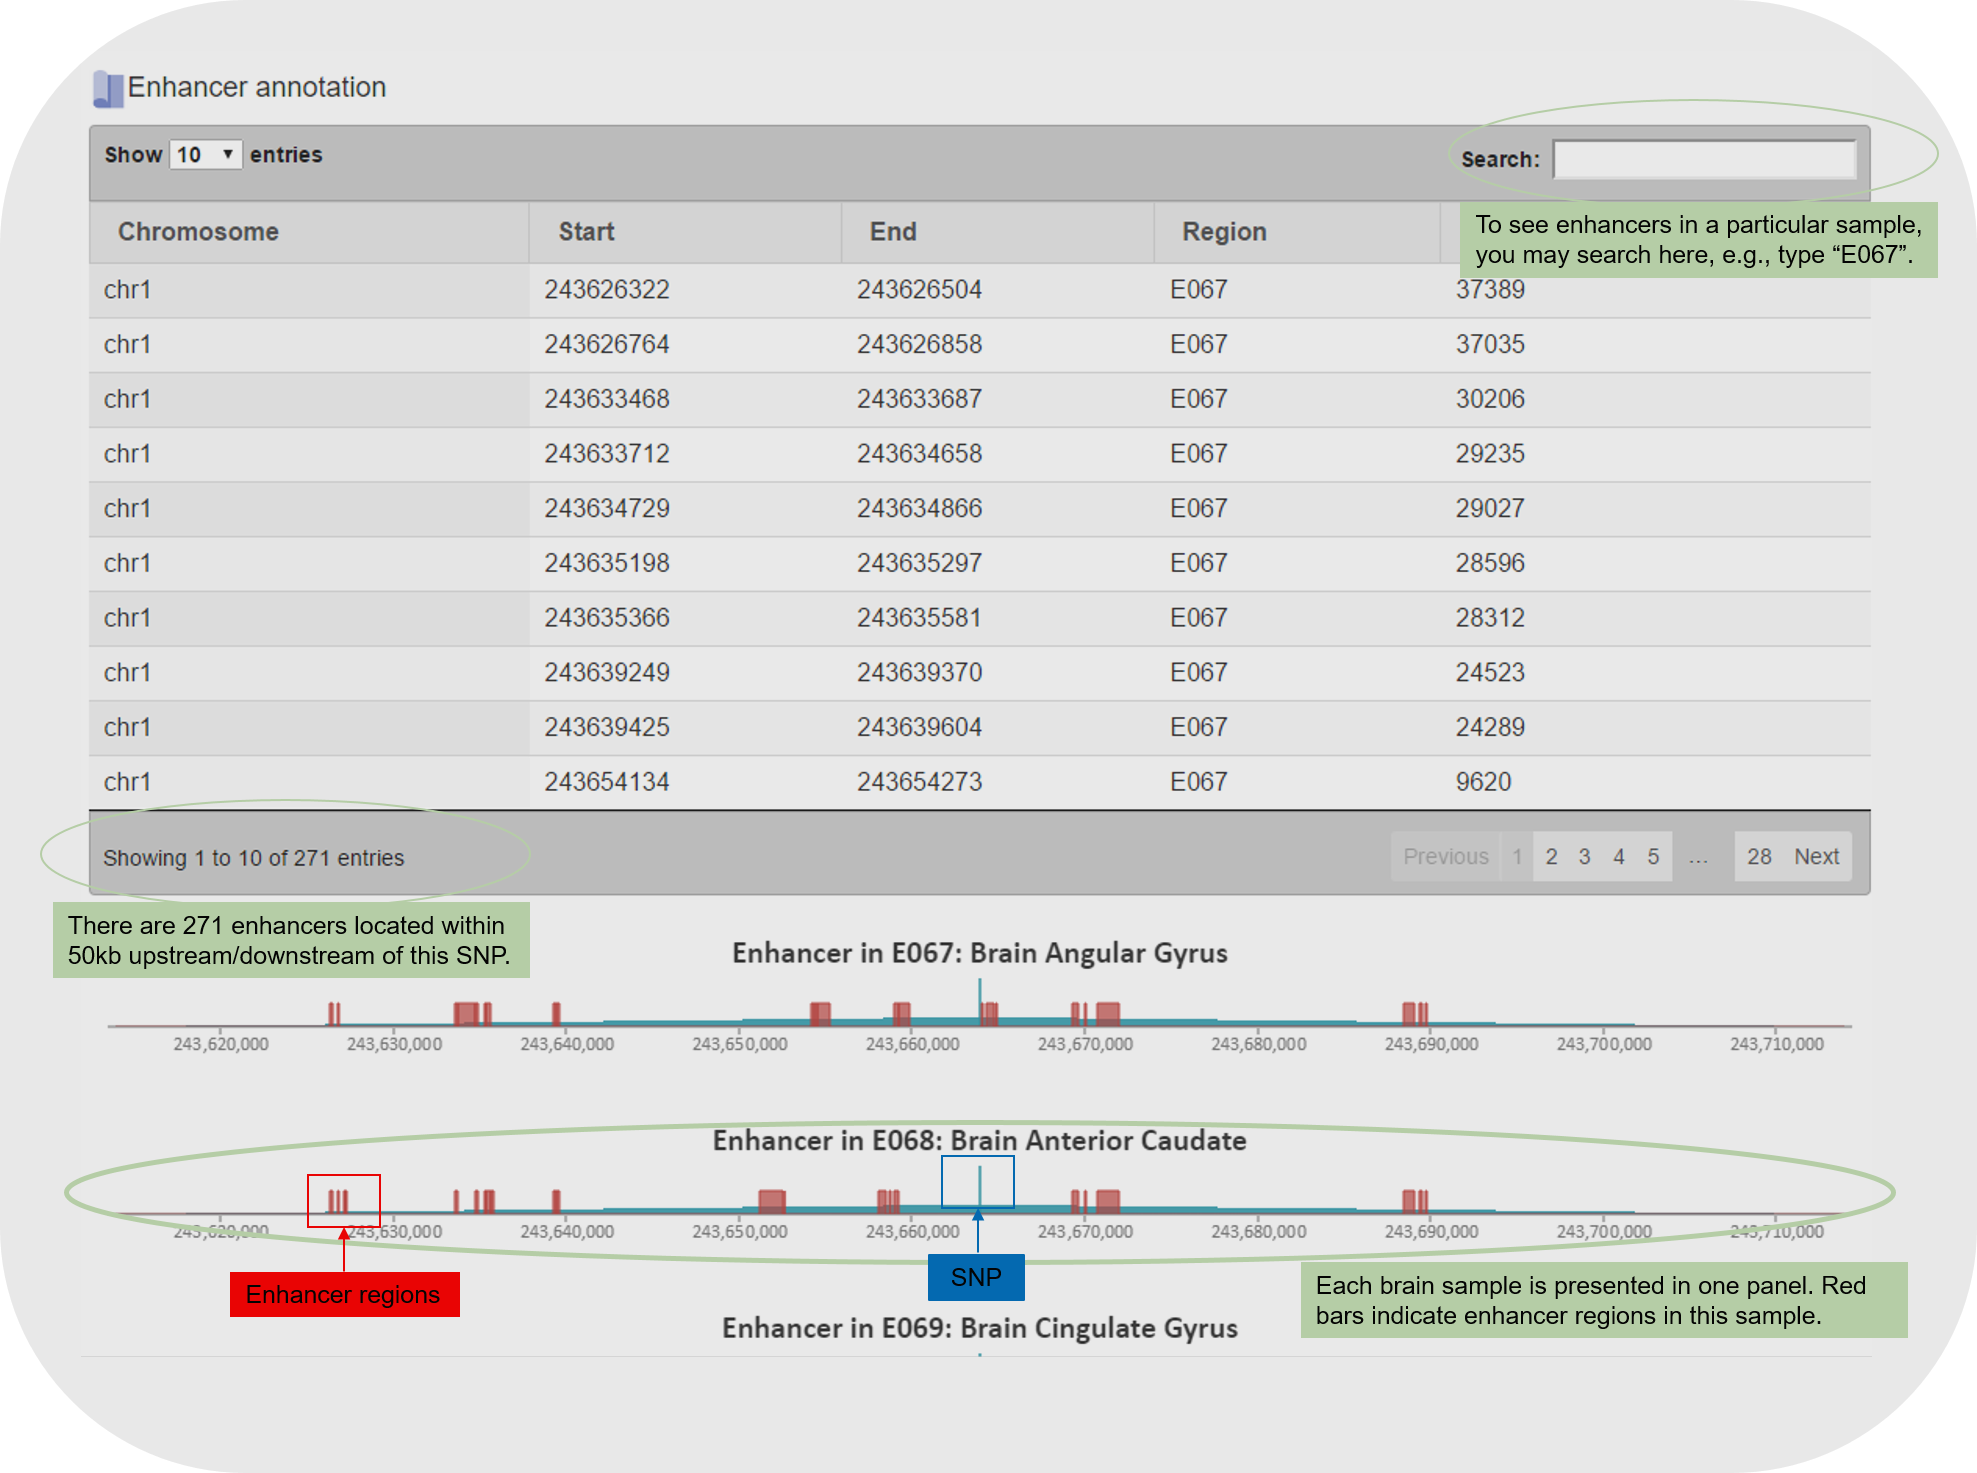
4.3 The enhancer and promoter information is listed as both tables and figures. For example:
The GENE page is heavily loaded with many types of information. It typically takes a few seconds to load.
5.1 The summary table of the Gene page shows all available information for a gene.
| Header | Example value | Annotation |
|---|---|---|
| GeneID | 10000 | The link will lead to the page in NCBI |
| Symbol | AKT3 | |
| Synonyms | MPPH|MPPH2|PKB-GAMMA|... | |
| Description | v-akt murine thymoma viral oncogene homolog 3 | |
| Reference | MIM:611223|HGNC:HGNC:393 |Ensembl:ENSG00000117020|... | The link will lead to the respective webpage about the gene. |
| Gene type | protein-coding | |
| Map location | 1q44 | |
| Pascal p-value | 0.5 | Gene-based p-value, obtained using the tool Pascal by combining all (PGC2) SNPs mapped to the gene within 50kb. |
| Sherlock p-value | 0.5 | Gene-based p-value, obtained using the tool Sherlock by combining all (PGC2) SNPs mapped to the gene and the Myers' eQTL data (both cis- and trans-effects are included). |
| Fetal beta | 0.41 | Beta value, calculated based on the BrainCloud developmental expression data. We followed the regression model proposed in the original work (PubMed), adjusting on 30 surrogate variables. A positive value indicates increased expression in fetal samples compared to after birth samples. A negative value indicates decreased expression comparing fetal and after-birth samples. A cutoff 0.5 or -0.5 is often considered to distinguish genes. |
| TADA p-value | 0.5 | Gene-based p-value, computed based on all de novo mutations (DNMs) in the gene. These DNMs were collected from 10 whole exome sequencing studies of schizophrenia trio samples. DNMs were defined as those that occurred in only the schizophrenia proband but not their parents. A TADA p-value <0.05 indicates the gene is nominally significant with DNMs in schizophrenia patients. |
| DEG p-value | 0.5 | P-value, obtained from differential gene expression studies. |
| DMG | 0-4 | The number of studies reporting the gene as a DMG. Range between 0 and 4. |
| Support | CompositeSet Darnell FMRP targets | Membership of the gene in our 39 manually collected gene sets |
5.2 The second summary table of the Gene page focuses on evidence supporting the gene in schizophrenia. It matches the column "SZ group" as shown in "3. The Search function" above.
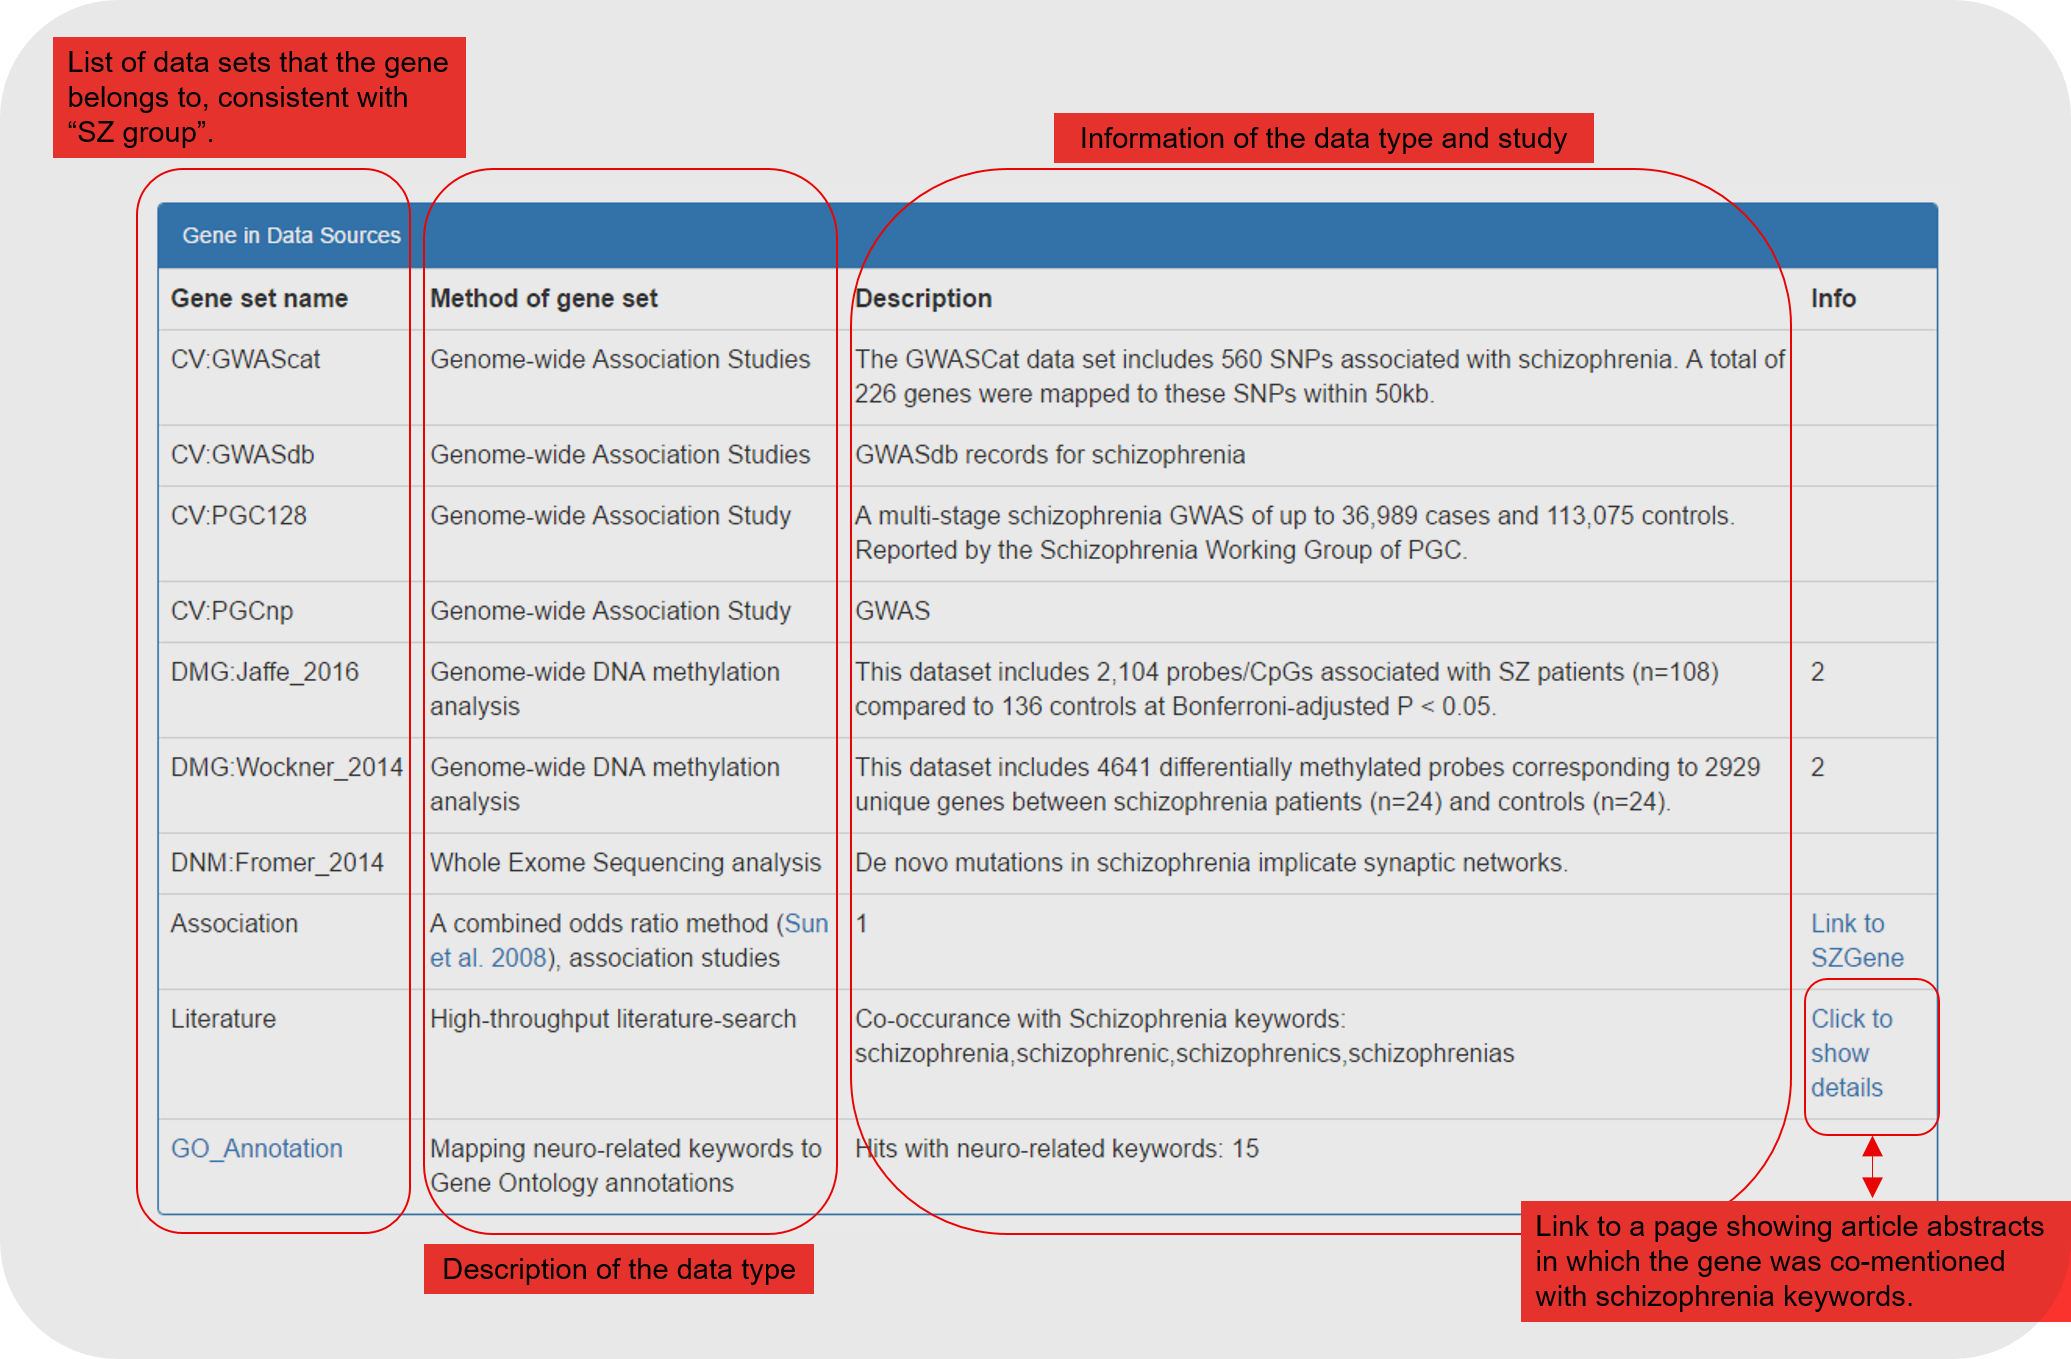
5.3 Following the summary table, we display all direct evidence (for which the gene was selected) and supportive annotation for the gene.
| Table / Section | Data format | Annotation |
|---|---|---|
| Gene in Data Sources | Table | Description of the datasets which reported the gene as related to schizophrenia |
| Section I. Genetics and epigenetics annotation | A list of tables | Original records of the SNPs related to the gene |
| Table | Original records of the SNPs mapped to the gene (50kb) in GWASdb. | |
| Table | Original records of the SNPs mapped to the gene (50kb) in GWAS Catalog. | |
| Table | Original records of the SNPs mapped to the gene (50kb) in PheWAS. | |
| Table | All PGC2 SNPs with nominal significant p-values that were mapped to the gene (50kb). | |
| Table | Original records of the gene and its nearest probes in differential methylation studies. The study names are listed in the last column "Study". Only shown when the gene is a DMG. | |
| Table | Description of the gene as an eGene in brain eQTL data. Only shown when the gene is an eGene. | |
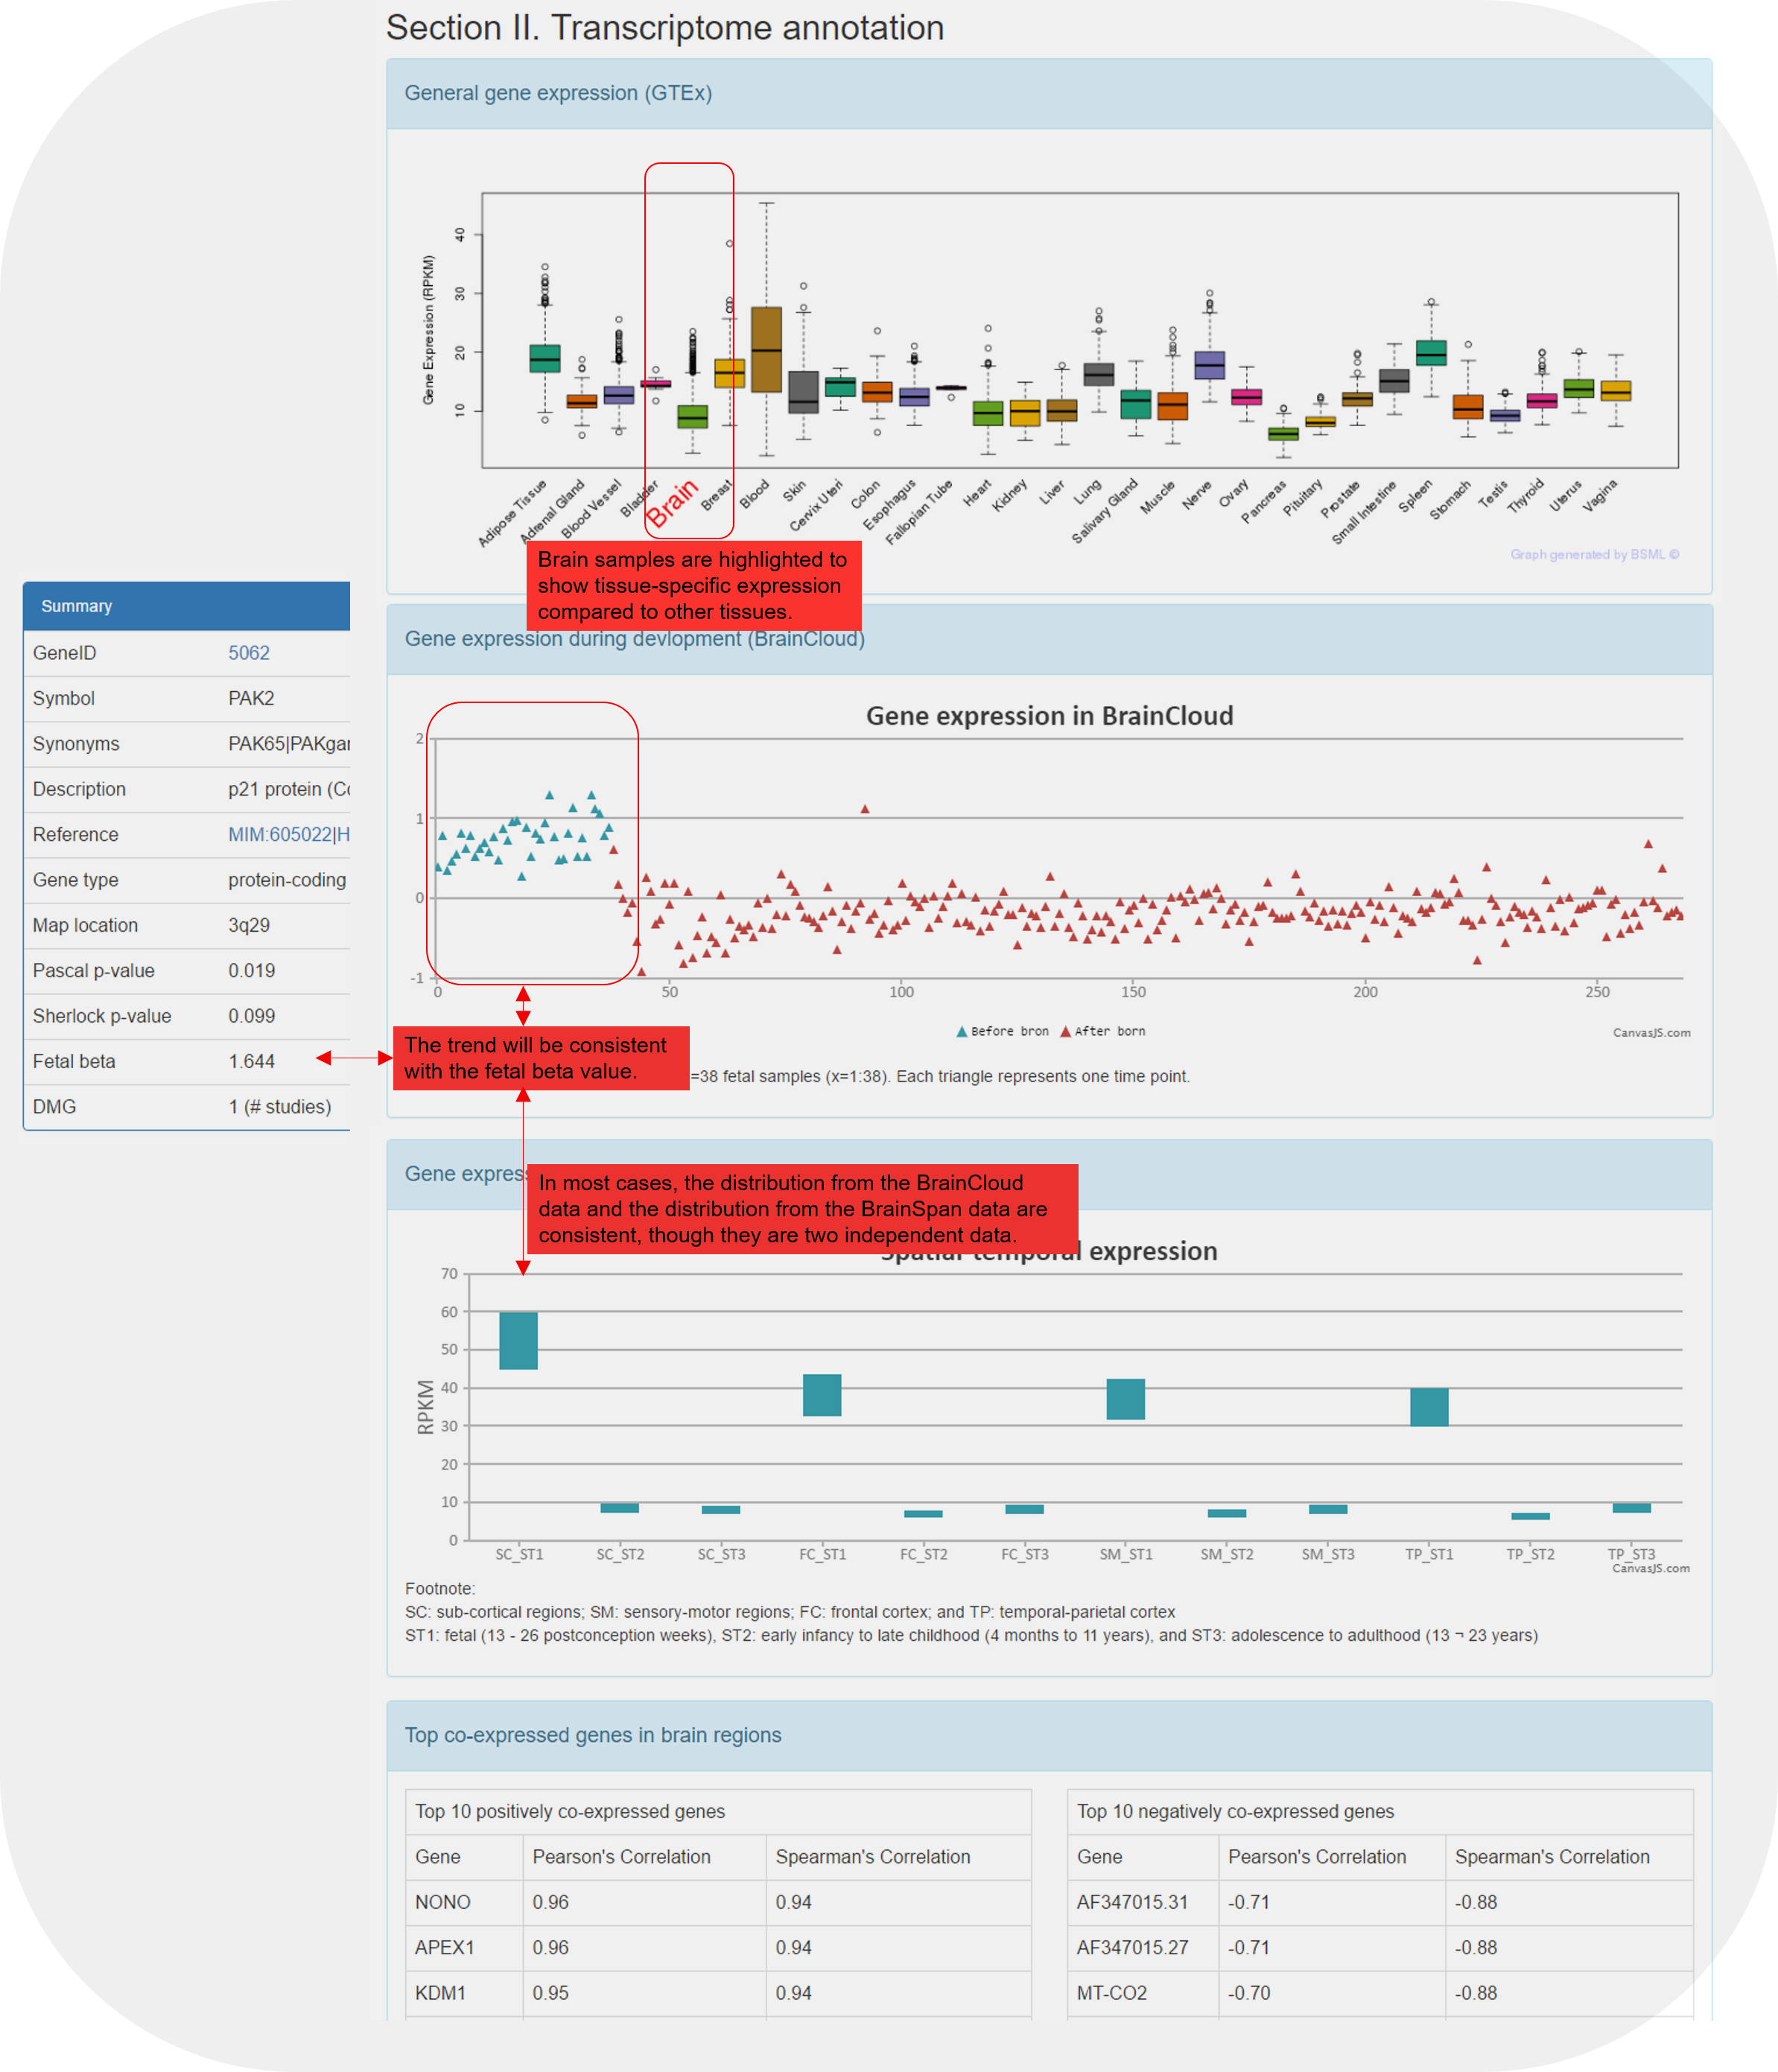
| Section II. Transcriptome annotation | A list of figures | Four ways of gene expression data |
| General gene expression (GTEx) | Figure | Distribution of the expression of the gene in different tissues based on GTEx data. Brain is highlighted in red. If the gene was not available in the GTEx data, it will be shown as "Not Available". |
| Gene expression during devlopment (BrainCloud) | Figure | Distribution of the expression of the gene in four brain regions and three developmental stages based on the BrainSpan data. Only shown when the gene is measured in the original expression data. |
| Gene expression of temporal and spatial changes (BrainSpan) | Figure | Distribution of the expression of the gene in 269 developmental stages. Samples 1:38 were taken before birth (shown in cyan). The same dataset was used to calculate the fetal beta value as shown in the gene summary table on top of each gene page. |
| Top co-expressed genes in brain regions | Table | The top ten most positively co-expressed genes and the top ten most negatively co-expressed genes based on the BrainSpan data. |
| Section III. Gene Ontology annotation | Table | Gene Ontology (GO) terms that are annotated to this gene. |
| Section IV. Protein-protein interaction annotation | Table | Protein-protein interactions that are annotated to this gene. |
| Section V. Pathway annotation | Table | MSigDB pathways that are annotated to this gene. |
| Section VI. microRNA annotation | Table | Shown if the gene is a target of a brain or schizophrenia microRNA. |
5.4 Illustration of the gene expression panels.