Gene Page: CDH18
Summary ?
| GeneID | 1016 |
| Symbol | CDH18 |
| Synonyms | CDH14|CDH14L|CDH24 |
| Description | cadherin 18 |
| Reference | MIM:603019|HGNC:HGNC:1757|Ensembl:ENSG00000145526|HPRD:04314|Vega:OTTHUMG00000090578 |
| Gene type | protein-coding |
| Map location | 5p14.3 |
| Pascal p-value | 0.109 |
| Sherlock p-value | 0.95 |
| Fetal beta | -2.191 |
| DMG | 1 (# studies) |
| eGene | Myers' cis & trans |
| Support | CELL ADHESION AND TRANSSYNAPTIC SIGNALING |
Gene in Data Sources
| Gene set name | Method of gene set | Description | Info |
|---|---|---|---|
| CV:GWASdb | Genome-wide Association Studies | GWASdb records for schizophrenia | |
| CV:PGCnp | Genome-wide Association Study | GWAS | |
| DMG:Wockner_2014 | Genome-wide DNA methylation analysis | This dataset includes 4641 differentially methylated probes corresponding to 2929 unique genes between schizophrenia patients (n=24) and controls (n=24). | 1 |
| PMID:cooccur | High-throughput literature-search | Systematic search in PubMed for genes co-occurring with SCZ keywords. A total of 3027 genes were included. | |
| Literature | High-throughput literature-search | Co-occurance with Schizophrenia keywords: schizophrenia,schizophrenias | Click to show details |
Section I. Genetics and epigenetics annotation
 Differentially methylated gene
| Probe | Chromosome | Position | Nearest gene | P (dis) | Beta (dis) | FDR (dis) | Study |
|---|---|---|---|---|---|---|---|
| cg24106898 | 5 | 19892970 | CDH18 | 1.601E-4 | 0.436 | 0.032 | DMG:Wockner_2014 |
eQTL annotation
| SNP ID | Chromosome | Position | eGene | Gene Entrez ID | pvalue | qvalue | TSS distance | eQTL type |
|---|---|---|---|---|---|---|---|---|
| rs10472832 | chr5 | 19087341 | CDH18 | 1016 | 0.16 | cis | ||
| rs586290 | chr5 | 19479745 | CDH18 | 1016 | 0.18 | cis | ||
| rs16955618 | chr15 | 29937543 | CDH18 | 1016 | 0.04 | trans |
Section II. Transcriptome annotation
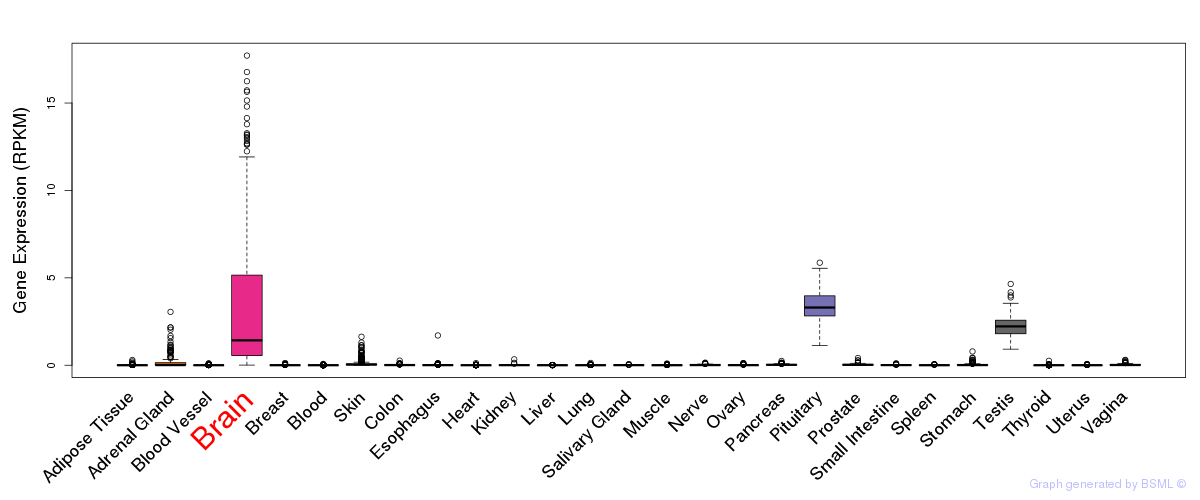
General gene expression (GTEx)
Gene expression during devlopment (BrainCloud)
Footnote:
A total of 269 time points ploted, with n=38 fetal samples (x=1:38). Each triangle represents one time point.
Gene expression of temporal and spatial changes (BrainSpan)
Footnote:
SC: sub-cortical regions; SM: sensory-motor regions; FC: frontal cortex; and TP: temporal-parietal cortex
ST1: fetal (13 - 26 postconception weeks), ST2: early infancy to late childhood (4 months to 11 years), and ST3: adolescence to adulthood (13 - 23 years)
The bar shown representes the lower 25% and upper 25% of the expression distribution.
Top co-expressed genes in brain regions
| Top 10 positively co-expressed genes | ||
| Gene | Pearson's Correlation | Spearman's Correlation |
| E2F2 | 0.78 | 0.27 |
| SP1 | 0.77 | 0.79 |
| ARHGAP19 | 0.76 | 0.70 |
| KIAA1958 | 0.76 | 0.71 |
| BRCA1 | 0.74 | 0.74 |
| MYBL1 | 0.74 | 0.70 |
| C19orf31 | 0.74 | 0.33 |
| NCAPD2 | 0.74 | 0.69 |
| LIMD1 | 0.74 | 0.60 |
| ZNF367 | 0.73 | 0.59 |
| Top 10 negatively co-expressed genes | ||
| Gene | Pearson's Correlation | Spearman's Correlation |
| AF347015.21 | -0.31 | -0.40 |
| CXCL14 | -0.31 | -0.40 |
| CLDND2 | -0.31 | -0.44 |
| IL32 | -0.30 | -0.50 |
| SYCP3 | -0.30 | -0.42 |
| C1orf54 | -0.29 | -0.40 |
| IFI27 | -0.29 | -0.35 |
| AC044839.2 | -0.28 | -0.38 |
| AF347015.31 | -0.28 | -0.33 |
| MYL3 | -0.28 | -0.34 |
Section V. Pathway annotation
| Pathway name | Pathway size | # SZGR 2.0 genes in pathway | Info |
|---|---|---|---|
| REACTOME CELL CELL COMMUNICATION | 120 | 77 | All SZGR 2.0 genes in this pathway |
| REACTOME ADHERENS JUNCTIONS INTERACTIONS | 27 | 20 | All SZGR 2.0 genes in this pathway |
| REACTOME CELL CELL JUNCTION ORGANIZATION | 56 | 31 | All SZGR 2.0 genes in this pathway |
| REACTOME CELL JUNCTION ORGANIZATION | 78 | 43 | All SZGR 2.0 genes in this pathway |
| SHEN SMARCA2 TARGETS DN | 357 | 212 | All SZGR 2.0 genes in this pathway |
| ONDER CDH1 TARGETS 2 UP | 256 | 159 | All SZGR 2.0 genes in this pathway |
| BLALOCK ALZHEIMERS DISEASE DN | 1237 | 837 | All SZGR 2.0 genes in this pathway |
| XU GH1 AUTOCRINE TARGETS UP | 268 | 157 | All SZGR 2.0 genes in this pathway |
| GENTILE UV LOW DOSE DN | 67 | 46 | All SZGR 2.0 genes in this pathway |
| MCCABE BOUND BY HOXC6 | 469 | 239 | All SZGR 2.0 genes in this pathway |
| GU PDEF TARGETS UP | 71 | 49 | All SZGR 2.0 genes in this pathway |
| KIM ALL DISORDERS OLIGODENDROCYTE NUMBER CORR UP | 756 | 494 | All SZGR 2.0 genes in this pathway |
| KIM BIPOLAR DISORDER OLIGODENDROCYTE DENSITY CORR UP | 682 | 440 | All SZGR 2.0 genes in this pathway |