Gene Page: ERN2
Summary ?
| GeneID | 10595 |
| Symbol | ERN2 |
| Synonyms | IRE1-BETA|IRE1b|IRE2p|hIRE2p |
| Description | endoplasmic reticulum to nucleus signaling 2 |
| Reference | MIM:604034|HGNC:HGNC:16942|Ensembl:ENSG00000134398|HPRD:04944|Vega:OTTHUMG00000177020 |
| Gene type | protein-coding |
| Map location | 16p12.2 |
| Pascal p-value | 0.243 |
| Fetal beta | -0.119 |
| DMG | 1 (# studies) |
Gene in Data Sources
| Gene set name | Method of gene set | Description | Info |
|---|---|---|---|
| CV:PGCnp | Genome-wide Association Study | GWAS | |
| DMG:Wockner_2014 | Genome-wide DNA methylation analysis | This dataset includes 4641 differentially methylated probes corresponding to 2929 unique genes between schizophrenia patients (n=24) and controls (n=24). | 1 |
| GSMA_IIE | Genome scan meta-analysis (European-ancestry samples) | Psr: 0.01775 |
Section I. Genetics and epigenetics annotation
 Differentially methylated gene
| Probe | Chromosome | Position | Nearest gene | P (dis) | Beta (dis) | FDR (dis) | Study |
|---|---|---|---|---|---|---|---|
| cg05131483 | 16 | 23706242 | ERN2 | 4.503E-4 | -0.352 | 0.045 | DMG:Wockner_2014 |
Section II. Transcriptome annotation
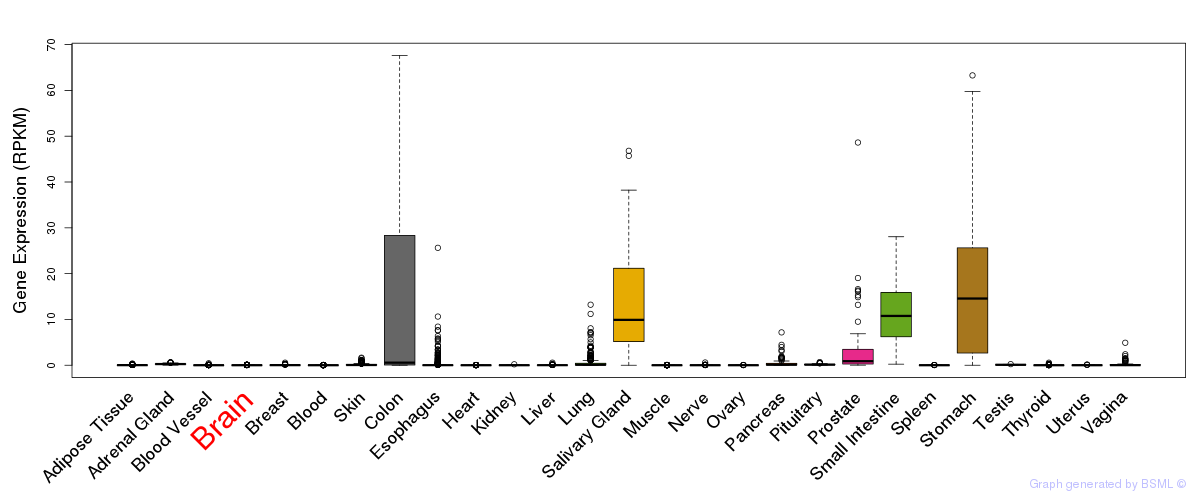
General gene expression (GTEx)

Gene expression during devlopment (BrainCloud)
Footnote:
A total of 269 time points ploted, with n=38 fetal samples (x=1:38). Each triangle represents one time point.
Gene expression of temporal and spatial changes (BrainSpan)
Footnote:
SC: sub-cortical regions; SM: sensory-motor regions; FC: frontal cortex; and TP: temporal-parietal cortex
ST1: fetal (13 - 26 postconception weeks), ST2: early infancy to late childhood (4 months to 11 years), and ST3: adolescence to adulthood (13 - 23 years)
The bar shown representes the lower 25% and upper 25% of the expression distribution.
Top co-expressed genes in brain regions
| Top 10 positively co-expressed genes | ||
| Gene | Pearson's Correlation | Spearman's Correlation |
| ENOSF1 | 0.61 | 0.53 |
| CHD1L | 0.61 | 0.58 |
| BEST1 | 0.59 | 0.53 |
| KIAA1755 | 0.58 | 0.58 |
| CDC14B | 0.58 | 0.56 |
| CYTSB | 0.58 | 0.57 |
| CA14 | 0.57 | 0.56 |
| IGSF11 | 0.57 | 0.52 |
| FAM63A | 0.56 | 0.51 |
| LITAF | 0.56 | 0.53 |
| Top 10 negatively co-expressed genes | ||
| Gene | Pearson's Correlation | Spearman's Correlation |
| C1orf86 | -0.40 | -0.44 |
| EMID1 | -0.38 | -0.42 |
| AC011491.1 | -0.35 | -0.39 |
| RPRM | -0.34 | -0.38 |
| RASGEF1C | -0.34 | -0.32 |
| CD1D | -0.34 | -0.36 |
| COMTD1 | -0.34 | -0.37 |
| GPRIN1 | -0.33 | -0.32 |
| SLC1A6 | -0.33 | -0.38 |
| LRFN4 | -0.33 | -0.35 |
Section III. Gene Ontology annotation
| Molecular function | GO term | Evidence | Neuro keywords | PubMed ID |
|---|---|---|---|---|
| GO:0000166 | nucleotide binding | IEA | - | |
| GO:0000287 | magnesium ion binding | IDA | 11175748 | |
| GO:0005524 | ATP binding | IDA | 11175748 | |
| GO:0004519 | endonuclease activity | IDA | 11175748 | |
| GO:0004674 | protein serine/threonine kinase activity | IDA | 11175748 | |
| GO:0016787 | hydrolase activity | IEA | - | |
| GO:0016740 | transferase activity | IEA | - | |
| GO:0016891 | endoribonuclease activity, producing 5'-phosphomonoesters | IEA | - | |
| Biological process | GO term | Evidence | Neuro keywords | PubMed ID |
| GO:0006355 | regulation of transcription, DNA-dependent | IEA | - | |
| GO:0006397 | mRNA processing | IEA | - | |
| GO:0006468 | protein amino acid phosphorylation | IDA | 11175748 | |
| GO:0016075 | rRNA catabolic process | IDA | 11175748 | |
| GO:0006917 | induction of apoptosis | IMP | 11175748 | |
| GO:0006950 | response to stress | IEA | - | |
| GO:0007050 | cell cycle arrest | IEA | - | |
| GO:0006915 | apoptosis | IEA | - | |
| GO:0016481 | negative regulation of transcription | IMP | 11175748 | |
| Cellular component | GO term | Evidence | Neuro keywords | PubMed ID |
| GO:0005789 | endoplasmic reticulum membrane | IEA | - | |
| GO:0005783 | endoplasmic reticulum | IEA | - | |
| GO:0016020 | membrane | IEA | - | |
| GO:0016021 | integral to membrane | IEA | - |
Section V. Pathway annotation
| Pathway name | Pathway size | # SZGR 2.0 genes in pathway | Info |
|---|---|---|---|
| BENPORATH CYCLING GENES | 648 | 385 | All SZGR 2.0 genes in this pathway |
| SHEN SMARCA2 TARGETS DN | 357 | 212 | All SZGR 2.0 genes in this pathway |
| WHITFIELD CELL CYCLE G2 M | 216 | 124 | All SZGR 2.0 genes in this pathway |
| ZWANG TRANSIENTLY UP BY 2ND EGF PULSE ONLY | 1725 | 838 | All SZGR 2.0 genes in this pathway |