Gene Page: USP16
Summary ?
| GeneID | 10600 |
| Symbol | USP16 |
| Synonyms | UBP-M|UBPM |
| Description | ubiquitin specific peptidase 16 |
| Reference | MIM:604735|HGNC:HGNC:12614|Ensembl:ENSG00000156256|HPRD:06881|Vega:OTTHUMG00000078802 |
| Gene type | protein-coding |
| Map location | 21q22.11 |
| Pascal p-value | 0.048 |
| Fetal beta | -0.392 |
| DMG | 1 (# studies) |
| eGene | Cerebellum |
| Support | Chromatin Remodeling Genes |
Gene in Data Sources
| Gene set name | Method of gene set | Description | Info |
|---|---|---|---|
| CV:PGCnp | Genome-wide Association Study | GWAS | |
| DMG:Jaffe_2016 | Genome-wide DNA methylation analysis | This dataset includes 2,104 probes/CpGs associated with SZ patients (n=108) compared to 136 controls at Bonferroni-adjusted P < 0.05. | 1 |
Section I. Genetics and epigenetics annotation
 Differentially methylated gene
| Probe | Chromosome | Position | Nearest gene | P (dis) | Beta (dis) | FDR (dis) | Study |
|---|---|---|---|---|---|---|---|
| cg14326747 | 21 | 30397409 | USP16 | 8.04E-9 | -0.019 | 3.84E-6 | DMG:Jaffe_2016 |
Section II. Transcriptome annotation
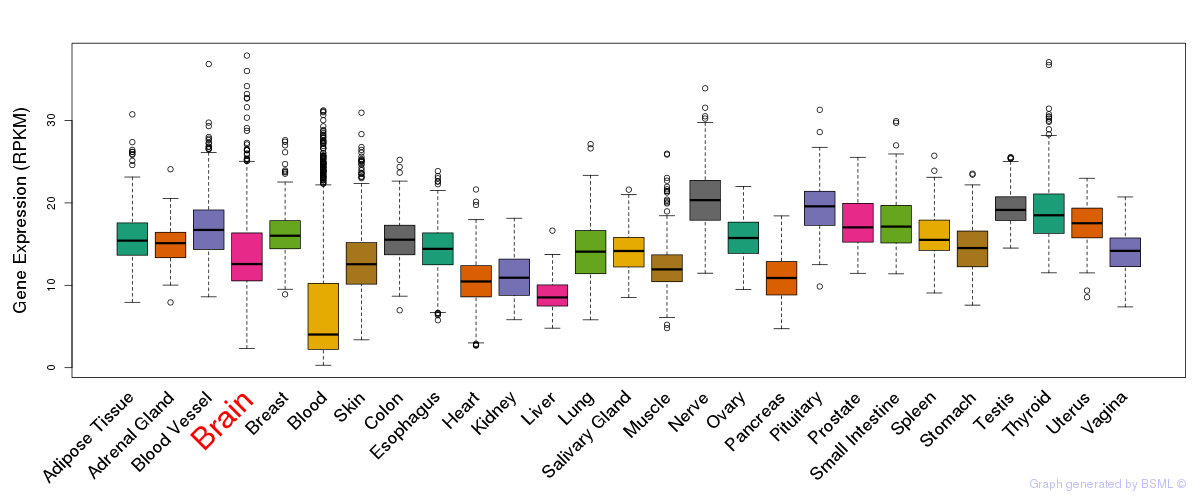
General gene expression (GTEx)
Gene expression during devlopment (BrainCloud)
Footnote:
A total of 269 time points ploted, with n=38 fetal samples (x=1:38). Each triangle represents one time point.
Gene expression of temporal and spatial changes (BrainSpan)
Footnote:
SC: sub-cortical regions; SM: sensory-motor regions; FC: frontal cortex; and TP: temporal-parietal cortex
ST1: fetal (13 - 26 postconception weeks), ST2: early infancy to late childhood (4 months to 11 years), and ST3: adolescence to adulthood (13 - 23 years)
The bar shown representes the lower 25% and upper 25% of the expression distribution.
Top co-expressed genes in brain regions
| Top 10 positively co-expressed genes | ||
| Gene | Pearson's Correlation | Spearman's Correlation |
| PLCD1 | 0.83 | 0.81 |
| SLC44A3 | 0.79 | 0.73 |
| BBOX1 | 0.79 | 0.76 |
| AGTRAP | 0.78 | 0.78 |
| FAH | 0.78 | 0.79 |
| SDC2 | 0.77 | 0.73 |
| ACAA2 | 0.77 | 0.70 |
| S1PR1 | 0.77 | 0.82 |
| SP110 | 0.77 | 0.71 |
| CPT2 | 0.77 | 0.71 |
| Top 10 negatively co-expressed genes | ||
| Gene | Pearson's Correlation | Spearman's Correlation |
| NELL2 | -0.49 | -0.53 |
| MYT1L | -0.49 | -0.50 |
| FAM49A | -0.49 | -0.52 |
| NOL4 | -0.48 | -0.49 |
| C1orf96 | -0.48 | -0.49 |
| PAK7 | -0.48 | -0.50 |
| MEF2C | -0.48 | -0.55 |
| SRPK1 | -0.47 | -0.50 |
| KHDRBS3 | -0.47 | -0.54 |
| MPPED1 | -0.47 | -0.52 |
Section V. Pathway annotation
| Pathway name | Pathway size | # SZGR 2.0 genes in pathway | Info |
|---|---|---|---|
| SENGUPTA NASOPHARYNGEAL CARCINOMA WITH LMP1 UP | 408 | 247 | All SZGR 2.0 genes in this pathway |
| GARY CD5 TARGETS DN | 431 | 263 | All SZGR 2.0 genes in this pathway |
| DEURIG T CELL PROLYMPHOCYTIC LEUKEMIA DN | 320 | 184 | All SZGR 2.0 genes in this pathway |
| OSMAN BLADDER CANCER UP | 404 | 246 | All SZGR 2.0 genes in this pathway |
| SENESE HDAC1 TARGETS UP | 457 | 269 | All SZGR 2.0 genes in this pathway |
| SENESE HDAC2 TARGETS UP | 114 | 66 | All SZGR 2.0 genes in this pathway |
| SENESE HDAC3 TARGETS UP | 501 | 327 | All SZGR 2.0 genes in this pathway |
| RODRIGUES THYROID CARCINOMA POORLY DIFFERENTIATED UP | 633 | 376 | All SZGR 2.0 genes in this pathway |
| RODRIGUES THYROID CARCINOMA ANAPLASTIC UP | 722 | 443 | All SZGR 2.0 genes in this pathway |
| MARTORIATI MDM4 TARGETS FETAL LIVER DN | 514 | 319 | All SZGR 2.0 genes in this pathway |
| SPIELMAN LYMPHOBLAST EUROPEAN VS ASIAN DN | 584 | 395 | All SZGR 2.0 genes in this pathway |
| SCHAEFFER PROSTATE DEVELOPMENT 6HR UP | 176 | 115 | All SZGR 2.0 genes in this pathway |
| BENPORATH NANOG TARGETS | 988 | 594 | All SZGR 2.0 genes in this pathway |
| BENPORATH CYCLING GENES | 648 | 385 | All SZGR 2.0 genes in this pathway |
| PEART HDAC PROLIFERATION CLUSTER DN | 76 | 57 | All SZGR 2.0 genes in this pathway |
| CHENG RESPONSE TO NICKEL ACETATE | 45 | 29 | All SZGR 2.0 genes in this pathway |
| CREIGHTON ENDOCRINE THERAPY RESISTANCE 5 | 482 | 296 | All SZGR 2.0 genes in this pathway |
| DE YY1 TARGETS DN | 92 | 64 | All SZGR 2.0 genes in this pathway |
| WILSON PROTEASES AT TUMOR BONE INTERFACE UP | 21 | 14 | All SZGR 2.0 genes in this pathway |
| MILI PSEUDOPODIA HAPTOTAXIS UP | 518 | 299 | All SZGR 2.0 genes in this pathway |
| ROME INSULIN TARGETS IN MUSCLE UP | 442 | 263 | All SZGR 2.0 genes in this pathway |
| WHITFIELD CELL CYCLE G2 M | 216 | 124 | All SZGR 2.0 genes in this pathway |