Gene Page: TAF6L
Summary ?
| GeneID | 10629 |
| Symbol | TAF6L |
| Synonyms | PAF65A |
| Description | TATA-box binding protein associated factor 6 like |
| Reference | MIM:602946|HGNC:HGNC:17305|Ensembl:ENSG00000162227|HPRD:04253|Vega:OTTHUMG00000167610 |
| Gene type | protein-coding |
| Map location | 11q12.3 |
| Pascal p-value | 0.438 |
| Sherlock p-value | 0.049 |
| Fetal beta | -0.211 |
Gene in Data Sources
| Gene set name | Method of gene set | Description | Info |
|---|---|---|---|
| CV:PGCnp | Genome-wide Association Study | GWAS | |
| DMG:Wockner_2014 | Genome-wide DNA methylation analysis | This dataset includes 4641 differentially methylated probes corresponding to 2929 unique genes between schizophrenia patients (n=24) and controls (n=24). | 1 |
Section I. Genetics and epigenetics annotation
 Differentially methylated gene
| Probe | Chromosome | Position | Nearest gene | P (dis) | Beta (dis) | FDR (dis) | Study |
|---|---|---|---|---|---|---|---|
| cg19905802 | 11 | 62554200 | TMEM179B;TAF6L | 4.295E-4 | -0.298 | 0.045 | DMG:Wockner_2014 |
Section II. Transcriptome annotation
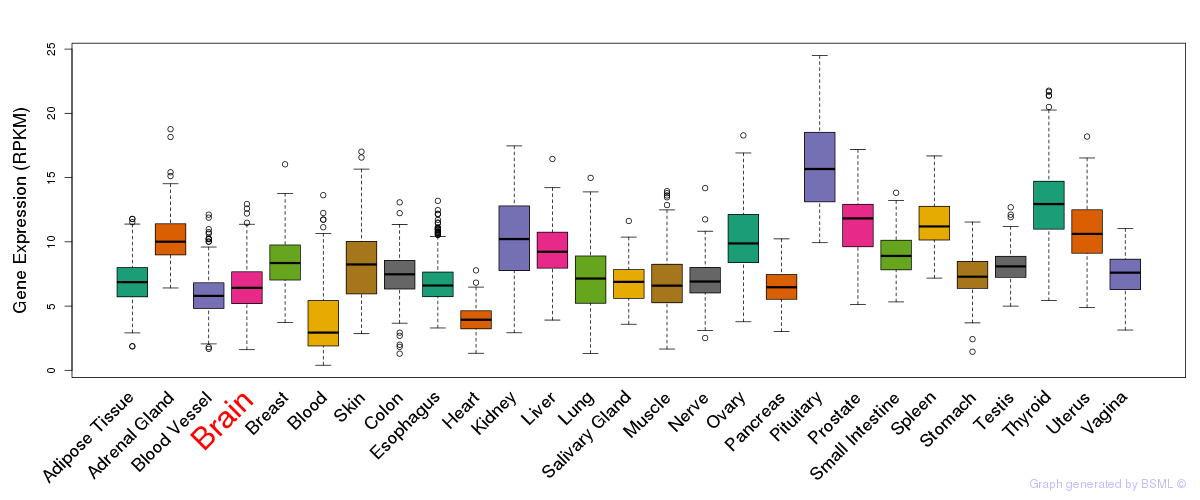
General gene expression (GTEx)
Gene expression during devlopment (BrainCloud)
Footnote:
A total of 269 time points ploted, with n=38 fetal samples (x=1:38). Each triangle represents one time point.
Gene expression of temporal and spatial changes (BrainSpan)
Footnote:
SC: sub-cortical regions; SM: sensory-motor regions; FC: frontal cortex; and TP: temporal-parietal cortex
ST1: fetal (13 - 26 postconception weeks), ST2: early infancy to late childhood (4 months to 11 years), and ST3: adolescence to adulthood (13 - 23 years)
The bar shown representes the lower 25% and upper 25% of the expression distribution.
Top co-expressed genes in brain regions
| Top 10 positively co-expressed genes | ||
| Gene | Pearson's Correlation | Spearman's Correlation |
| MTMR6 | 0.95 | 0.95 |
| UHRF1BP1L | 0.93 | 0.92 |
| TRIM23 | 0.92 | 0.92 |
| RPRD1A | 0.92 | 0.93 |
| PJA2 | 0.92 | 0.93 |
| CASD1 | 0.91 | 0.89 |
| PPP2R5C | 0.91 | 0.90 |
| GRSF1 | 0.91 | 0.89 |
| CLTC | 0.91 | 0.91 |
| TRIM37 | 0.91 | 0.92 |
| Top 10 negatively co-expressed genes | ||
| Gene | Pearson's Correlation | Spearman's Correlation |
| AF347015.21 | -0.61 | -0.46 |
| AF347015.18 | -0.59 | -0.53 |
| MT-CO2 | -0.57 | -0.48 |
| HIGD1B | -0.57 | -0.48 |
| AF347015.26 | -0.57 | -0.44 |
| AF347015.8 | -0.56 | -0.47 |
| AF347015.2 | -0.56 | -0.44 |
| EIF4EBP3 | -0.56 | -0.59 |
| FXYD1 | -0.56 | -0.51 |
| AP002478.3 | -0.56 | -0.54 |
Section V. Pathway annotation
| Pathway name | Pathway size | # SZGR 2.0 genes in pathway | Info |
|---|---|---|---|
| KEGG BASAL TRANSCRIPTION FACTORS | 36 | 24 | All SZGR 2.0 genes in this pathway |
| DIAZ CHRONIC MEYLOGENOUS LEUKEMIA UP | 1382 | 904 | All SZGR 2.0 genes in this pathway |
| DOANE RESPONSE TO ANDROGEN UP | 184 | 125 | All SZGR 2.0 genes in this pathway |
| KIM WT1 TARGETS 12HR UP | 162 | 116 | All SZGR 2.0 genes in this pathway |
| OLSSON E2F3 TARGETS DN | 49 | 33 | All SZGR 2.0 genes in this pathway |
| TANAKA METHYLATED IN ESOPHAGEAL CARCINOMA | 103 | 58 | All SZGR 2.0 genes in this pathway |
| LASTOWSKA NEUROBLASTOMA COPY NUMBER DN | 800 | 473 | All SZGR 2.0 genes in this pathway |
| NAGY TFTC COMPONENTS HUMAN | 19 | 11 | All SZGR 2.0 genes in this pathway |
| NAGY STAGA COMPONENTS HUMAN | 15 | 8 | All SZGR 2.0 genes in this pathway |
| NAGY PCAF COMPONENTS HUMAN | 9 | 7 | All SZGR 2.0 genes in this pathway |
| SCHLOSSER SERUM RESPONSE AUGMENTED BY MYC | 108 | 74 | All SZGR 2.0 genes in this pathway |
| SAKAI TUMOR INFILTRATING MONOCYTES DN | 81 | 51 | All SZGR 2.0 genes in this pathway |
| THEILGAARD NEUTROPHIL AT SKIN WOUND UP | 77 | 52 | All SZGR 2.0 genes in this pathway |
| BROWNE HCMV INFECTION 20HR UP | 240 | 152 | All SZGR 2.0 genes in this pathway |
| BROWNE HCMV INFECTION 14HR UP | 156 | 101 | All SZGR 2.0 genes in this pathway |
| CUI TCF21 TARGETS 2 UP | 428 | 266 | All SZGR 2.0 genes in this pathway |
| ACEVEDO LIVER CANCER DN | 540 | 340 | All SZGR 2.0 genes in this pathway |
| BONOME OVARIAN CANCER SURVIVAL SUBOPTIMAL DEBULKING | 510 | 309 | All SZGR 2.0 genes in this pathway |