Gene Page: NPRL2
Summary ?
| GeneID | 10641 |
| Symbol | NPRL2 |
| Synonyms | NPR2|NPR2L|TUSC4 |
| Description | NPR2-like, GATOR1 complex subunit |
| Reference | MIM:607072|HGNC:HGNC:24969|Ensembl:ENSG00000114388|HPRD:06147|Vega:OTTHUMG00000156864 |
| Gene type | protein-coding |
| Map location | 3p21.3 |
| Pascal p-value | 0.162 |
| Sherlock p-value | 0.955 |
| TADA p-value | 0.01 |
| Fetal beta | 0.205 |
| DMG | 1 (# studies) |
| Support | CompositeSet |
Gene in Data Sources
| Gene set name | Method of gene set | Description | Info |
|---|---|---|---|
| CV:PGCnp | Genome-wide Association Study | GWAS | |
| DMG:Jaffe_2016 | Genome-wide DNA methylation analysis | This dataset includes 2,104 probes/CpGs associated with SZ patients (n=108) compared to 136 controls at Bonferroni-adjusted P < 0.05. | 1 |
| DNM:Xu_2012 | Whole Exome Sequencing analysis | De novo mutations of 4 genes were identified by exome sequencing of 795 samples in this study |
Section I. Genetics and epigenetics annotation
 DNM table
| Gene | Chromosome | Position | Ref | Alt | Transcript | AA change | Mutation type | Sift | CG46 | Trait | Study |
|---|---|---|---|---|---|---|---|---|---|---|---|
| NPRL2 | chr3 | 50385987 | C | T | NM_006545 | p.231G>S | missense | Schizophrenia | DNM:Xu_2012 |
Differentially methylated gene
| Probe | Chromosome | Position | Nearest gene | P (dis) | Beta (dis) | FDR (dis) | Study |
|---|---|---|---|---|---|---|---|
| cg00734800 | 3 | 50388182 | NPRL2 | 1.84E-9 | -0.015 | 1.57E-6 | DMG:Jaffe_2016 |
Section II. Transcriptome annotation
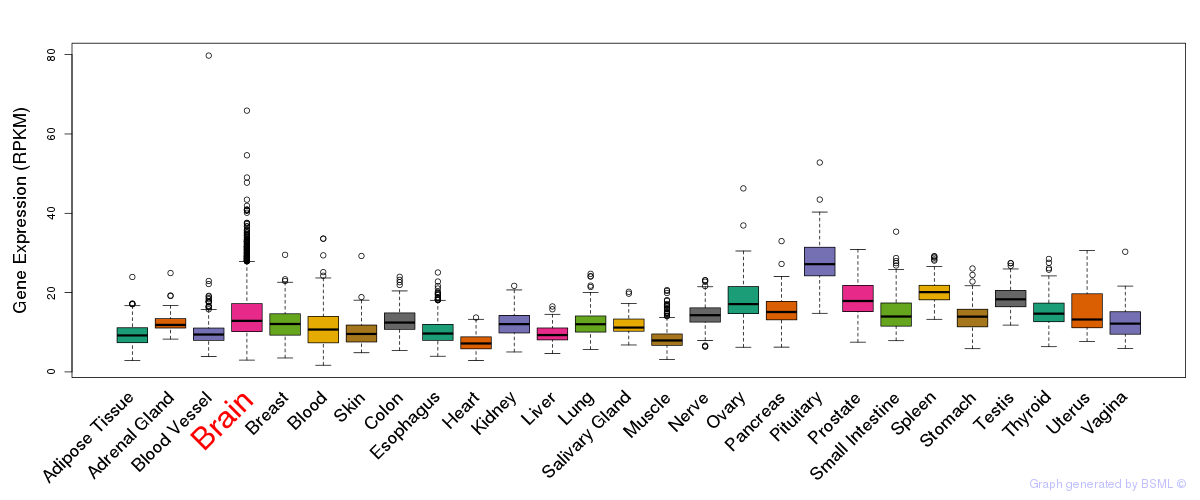
General gene expression (GTEx)
Gene expression during devlopment (BrainCloud)
Footnote:
A total of 269 time points ploted, with n=38 fetal samples (x=1:38). Each triangle represents one time point.
Gene expression of temporal and spatial changes (BrainSpan)
Footnote:
SC: sub-cortical regions; SM: sensory-motor regions; FC: frontal cortex; and TP: temporal-parietal cortex
ST1: fetal (13 - 26 postconception weeks), ST2: early infancy to late childhood (4 months to 11 years), and ST3: adolescence to adulthood (13 - 23 years)
The bar shown representes the lower 25% and upper 25% of the expression distribution.
Top co-expressed genes in brain regions
| Top 10 positively co-expressed genes | ||
| Gene | Pearson's Correlation | Spearman's Correlation |
| VPS29 | 0.81 | 0.84 |
| NFU1 | 0.81 | 0.84 |
| PSMA3 | 0.81 | 0.81 |
| NDUFS4 | 0.80 | 0.83 |
| MRPL1 | 0.80 | 0.87 |
| NT5C3L | 0.80 | 0.78 |
| TXNDC9 | 0.80 | 0.85 |
| PSMA5 | 0.80 | 0.80 |
| MRPL47 | 0.80 | 0.83 |
| STARD3NL | 0.80 | 0.77 |
| Top 10 negatively co-expressed genes | ||
| Gene | Pearson's Correlation | Spearman's Correlation |
| AF347015.26 | -0.60 | -0.59 |
| AF347015.15 | -0.58 | -0.55 |
| AF347015.8 | -0.58 | -0.54 |
| AF347015.2 | -0.58 | -0.55 |
| AF347015.33 | -0.57 | -0.55 |
| FAM38A | -0.57 | -0.60 |
| AF347015.27 | -0.55 | -0.53 |
| MT-CYB | -0.55 | -0.53 |
| AF347015.18 | -0.55 | -0.55 |
| TENC1 | -0.54 | -0.56 |
Section V. Pathway annotation
| Pathway name | Pathway size | # SZGR 2.0 genes in pathway | Info |
|---|---|---|---|
| PARENT MTOR SIGNALING UP | 567 | 375 | All SZGR 2.0 genes in this pathway |
| VANHARANTA UTERINE FIBROID WITH 7Q DELETION UP | 67 | 37 | All SZGR 2.0 genes in this pathway |
| HESSON TUMOR SUPPRESSOR CLUSTER 3P21 3 | 7 | 5 | All SZGR 2.0 genes in this pathway |
| DACOSTA UV RESPONSE VIA ERCC3 UP | 309 | 199 | All SZGR 2.0 genes in this pathway |
| JAZAG TGFB1 SIGNALING VIA SMAD4 UP | 108 | 66 | All SZGR 2.0 genes in this pathway |
| PUJANA ATM PCC NETWORK | 1442 | 892 | All SZGR 2.0 genes in this pathway |
| RICKMAN TUMOR DIFFERENTIATED WELL VS MODERATELY UP | 109 | 69 | All SZGR 2.0 genes in this pathway |
| BENPORATH MYC MAX TARGETS | 775 | 494 | All SZGR 2.0 genes in this pathway |
| STARK PREFRONTAL CORTEX 22Q11 DELETION DN | 517 | 309 | All SZGR 2.0 genes in this pathway |
| MUNSHI MULTIPLE MYELOMA DN | 11 | 6 | All SZGR 2.0 genes in this pathway |
| KAAB FAILED HEART ATRIUM DN | 141 | 99 | All SZGR 2.0 genes in this pathway |
| LEE CALORIE RESTRICTION NEOCORTEX UP | 83 | 66 | All SZGR 2.0 genes in this pathway |
| DEBIASI APOPTOSIS BY REOVIRUS INFECTION DN | 287 | 208 | All SZGR 2.0 genes in this pathway |
| SATO SILENCED BY DEACETYLATION IN PANCREATIC CANCER | 50 | 30 | All SZGR 2.0 genes in this pathway |
| KRIGE RESPONSE TO TOSEDOSTAT 6HR DN | 911 | 527 | All SZGR 2.0 genes in this pathway |
| KRIGE RESPONSE TO TOSEDOSTAT 24HR DN | 1011 | 592 | All SZGR 2.0 genes in this pathway |
| ACEVEDO NORMAL TISSUE ADJACENT TO LIVER TUMOR DN | 354 | 216 | All SZGR 2.0 genes in this pathway |
| DANG BOUND BY MYC | 1103 | 714 | All SZGR 2.0 genes in this pathway |