Gene Page: GAB4
Summary ?
| GeneID | 128954 |
| Symbol | GAB4 |
| Synonyms | - |
| Description | GRB2 associated binding protein family member 4 |
| Reference | HGNC:HGNC:18325|Ensembl:ENSG00000215568|Vega:OTTHUMG00000149992 |
| Gene type | protein-coding |
| Map location | 22q11.1 |
| Pascal p-value | 0.509 |
| Fetal beta | -0.049 |
| DMG | 1 (# studies) |
Gene in Data Sources
| Gene set name | Method of gene set | Description | Info |
|---|---|---|---|
| CV:PGCnp | Genome-wide Association Study | GWAS | |
| DMG:Wockner_2014 | Genome-wide DNA methylation analysis | This dataset includes 4641 differentially methylated probes corresponding to 2929 unique genes between schizophrenia patients (n=24) and controls (n=24). | 1 |
| GSMA_I | Genome scan meta-analysis | Psr: 0.031 |
Section I. Genetics and epigenetics annotation
 Differentially methylated gene
| Probe | Chromosome | Position | Nearest gene | P (dis) | Beta (dis) | FDR (dis) | Study |
|---|---|---|---|---|---|---|---|
| cg03308092 | 22 | 17488275 | GAB4 | 4.07E-5 | 0.555 | 0.02 | DMG:Wockner_2014 |
Section II. Transcriptome annotation
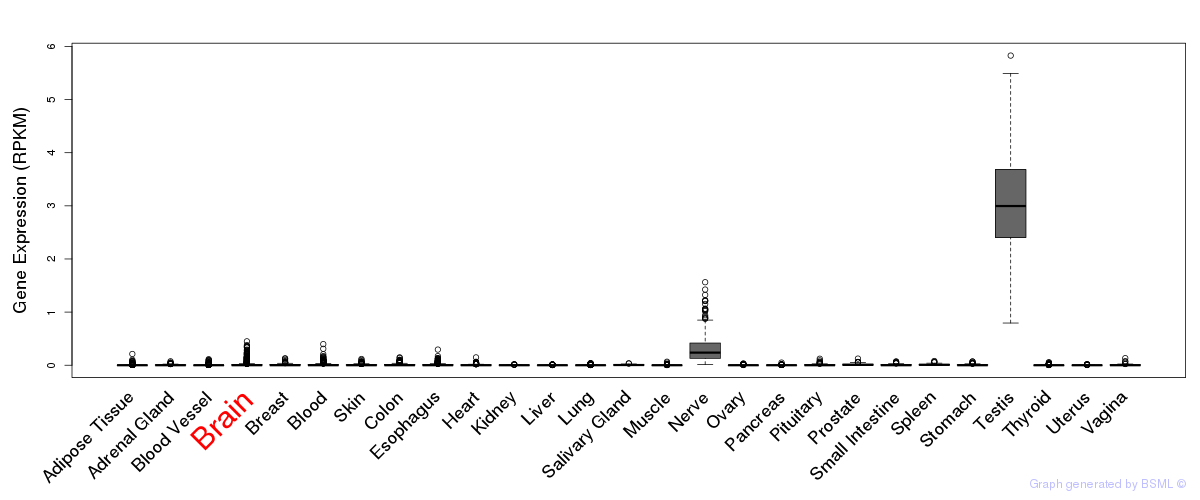
General gene expression (GTEx)
Gene expression during devlopment (BrainCloud)
Footnote:
A total of 269 time points ploted, with n=38 fetal samples (x=1:38). Each triangle represents one time point.
Gene expression of temporal and spatial changes (BrainSpan)
Footnote:
SC: sub-cortical regions; SM: sensory-motor regions; FC: frontal cortex; and TP: temporal-parietal cortex
ST1: fetal (13 - 26 postconception weeks), ST2: early infancy to late childhood (4 months to 11 years), and ST3: adolescence to adulthood (13 - 23 years)
The bar shown representes the lower 25% and upper 25% of the expression distribution.
Top co-expressed genes in brain regions
| Top 10 positively co-expressed genes | ||
| Gene | Pearson's Correlation | Spearman's Correlation |
| FKRP | 0.82 | 0.84 |
| DMWD | 0.80 | 0.81 |
| BCAR1 | 0.80 | 0.84 |
| NR2F6 | 0.80 | 0.85 |
| C11orf68 | 0.80 | 0.82 |
| FAM120AOS | 0.80 | 0.79 |
| CCDC86 | 0.79 | 0.80 |
| ZSCAN18 | 0.79 | 0.81 |
| EPN1 | 0.79 | 0.80 |
| FBXO31 | 0.79 | 0.80 |
| Top 10 negatively co-expressed genes | ||
| Gene | Pearson's Correlation | Spearman's Correlation |
| AF347015.21 | -0.57 | -0.47 |
| AF347015.31 | -0.53 | -0.45 |
| MT-CO2 | -0.52 | -0.44 |
| AF347015.8 | -0.52 | -0.45 |
| NOSTRIN | -0.51 | -0.45 |
| AL139819.3 | -0.51 | -0.50 |
| AF347015.18 | -0.51 | -0.44 |
| AF347015.33 | -0.50 | -0.42 |
| AP002478.3 | -0.50 | -0.45 |
| SYCP3 | -0.49 | -0.56 |
Section V. Pathway annotation
| Pathway name | Pathway size | # SZGR 2.0 genes in pathway | Info |
|---|---|---|---|
| CERIBELLI GENES INACTIVE AND BOUND BY NFY | 45 | 27 | All SZGR 2.0 genes in this pathway |
| ZWANG TRANSIENTLY UP BY 2ND EGF PULSE ONLY | 1725 | 838 | All SZGR 2.0 genes in this pathway |
Section VI. microRNA annotation
| miRNA family | Target position | miRNA ID | miRNA seq | ||
|---|---|---|---|---|---|
| UTR start | UTR end | Match method | |||
| miR-125/351 | 77 | 83 | 1A | hsa-miR-125bbrain | UCCCUGAGACCCUAACUUGUGA |
| hsa-miR-125abrain | UCCCUGAGACCCUUUAACCUGUG | ||||
- SZ: miRNAs which differentially expressed in brain cortex of schizophrenia patients comparing with control samples using microarray. Click here to see the list of SZ related miRNAs.
- Brain: miRNAs which are expressed in brain based on miRNA microarray expression studies. Click here to see the list of brain related miRNAs.