Gene Page: CILP2
Summary ?
| GeneID | 148113 |
| Symbol | CILP2 |
| Synonyms | CLIP-2 |
| Description | cartilage intermediate layer protein 2 |
| Reference | MIM:612419|HGNC:HGNC:24213|Ensembl:ENSG00000160161|HPRD:16714|Vega:OTTHUMG00000182148 |
| Gene type | protein-coding |
| Map location | 19p13.11 |
| Pascal p-value | 1.387E-7 |
| Fetal beta | -0.24 |
| DMG | 1 (# studies) |
| eGene | Caudate basal ganglia Myers' cis & trans |
Gene in Data Sources
| Gene set name | Method of gene set | Description | Info |
|---|---|---|---|
| CV:PGCnp | Genome-wide Association Study | GWAS | |
| DMG:Wockner_2014 | Genome-wide DNA methylation analysis | This dataset includes 4641 differentially methylated probes corresponding to 2929 unique genes between schizophrenia patients (n=24) and controls (n=24). | 1 |
| DNM:Guipponi_2014 | Whole Exome Sequencing analysis | 49 DNMs were identified by comparing the exome of 53 individuals with sporadic SCZ and of their non-affected parents | |
| LK:YES | Genome-wide Association Study | This data set included 99 genes mapped to the 22 regions. The 24 leading SNPs were also included in CV:Ripke_2013 |
Section I. Genetics and epigenetics annotation
 DNM table
| Gene | Chromosome | Position | Ref | Alt | Transcript | AA change | Mutation type | Sift | CG46 | Trait | Study |
|---|---|---|---|---|---|---|---|---|---|---|---|
| CILP2 | G | A | NM_153221 | p.R347Q | missense | 0.26 | 0.41 | Schizophrenia | DNM:Guipponi_2014 |
Differentially methylated gene
| Probe | Chromosome | Position | Nearest gene | P (dis) | Beta (dis) | FDR (dis) | Study |
|---|---|---|---|---|---|---|---|
| cg10669058 | 19 | 19648555 | CILP2 | 2.012E-4 | 0.44 | 0.035 | DMG:Wockner_2014 |
eQTL annotation
| SNP ID | Chromosome | Position | eGene | Gene Entrez ID | pvalue | qvalue | TSS distance | eQTL type |
|---|---|---|---|---|---|---|---|---|
| rs16869851 | chr4 | 20690056 | CILP2 | 148113 | 0.11 | trans |
Section II. Transcriptome annotation
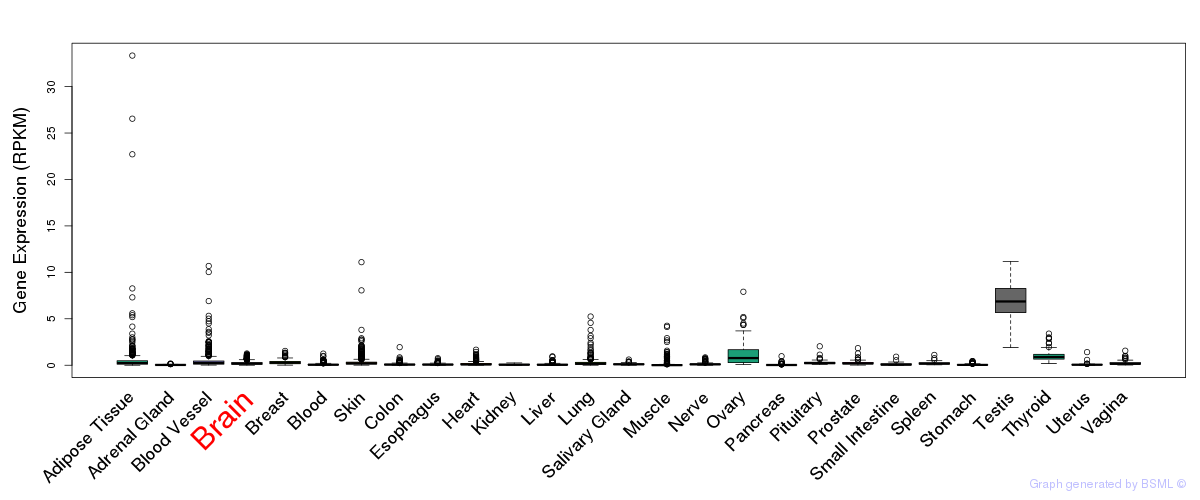
General gene expression (GTEx)
Gene expression during devlopment (BrainCloud)
Footnote:
A total of 269 time points ploted, with n=38 fetal samples (x=1:38). Each triangle represents one time point.
Gene expression of temporal and spatial changes (BrainSpan)
Footnote:
SC: sub-cortical regions; SM: sensory-motor regions; FC: frontal cortex; and TP: temporal-parietal cortex
ST1: fetal (13 - 26 postconception weeks), ST2: early infancy to late childhood (4 months to 11 years), and ST3: adolescence to adulthood (13 - 23 years)
The bar shown representes the lower 25% and upper 25% of the expression distribution.
No co-expressed genes in brain regions
Section V. Pathway annotation
| Pathway name | Pathway size | # SZGR 2.0 genes in pathway | Info |
|---|---|---|---|
| NING CHRONIC OBSTRUCTIVE PULMONARY DISEASE UP | 157 | 105 | All SZGR 2.0 genes in this pathway |
| MCCABE BOUND BY HOXC6 | 469 | 239 | All SZGR 2.0 genes in this pathway |
| NABA ECM GLYCOPROTEINS | 196 | 99 | All SZGR 2.0 genes in this pathway |
| NABA CORE MATRISOME | 275 | 148 | All SZGR 2.0 genes in this pathway |
| NABA MATRISOME | 1028 | 559 | All SZGR 2.0 genes in this pathway |