Gene Page: SLC26A3
Summary ?
| GeneID | 1811 |
| Symbol | SLC26A3 |
| Synonyms | CLD|DRA |
| Description | solute carrier family 26 member 3 |
| Reference | MIM:126650|HGNC:HGNC:3018|Ensembl:ENSG00000091138|HPRD:00544|Vega:OTTHUMG00000154812 |
| Gene type | protein-coding |
| Map location | 7q31 |
| Pascal p-value | 0.506 |
| eGene | Myers' cis & trans Meta |
Gene in Data Sources
| Gene set name | Method of gene set | Description | Info |
|---|---|---|---|
| CV:PGCnp | Genome-wide Association Study | GWAS | |
| CV:PheWAS | Phenome-wide association studies (PheWAS) | 157 SNPs associated with schizophrenia | 0 |
Section I. Genetics and epigenetics annotation
 CV:PheWAS
| SNP ID | Chromosome | Position | Allele | P | Function | Gene | Up/Down Distance |
|---|
eQTL annotation
| SNP ID | Chromosome | Position | eGene | Gene Entrez ID | pvalue | qvalue | TSS distance | eQTL type |
|---|---|---|---|---|---|---|---|---|
| rs16869851 | chr4 | 20690056 | SLC26A3 | 1811 | 0.1 | trans |
Section II. Transcriptome annotation
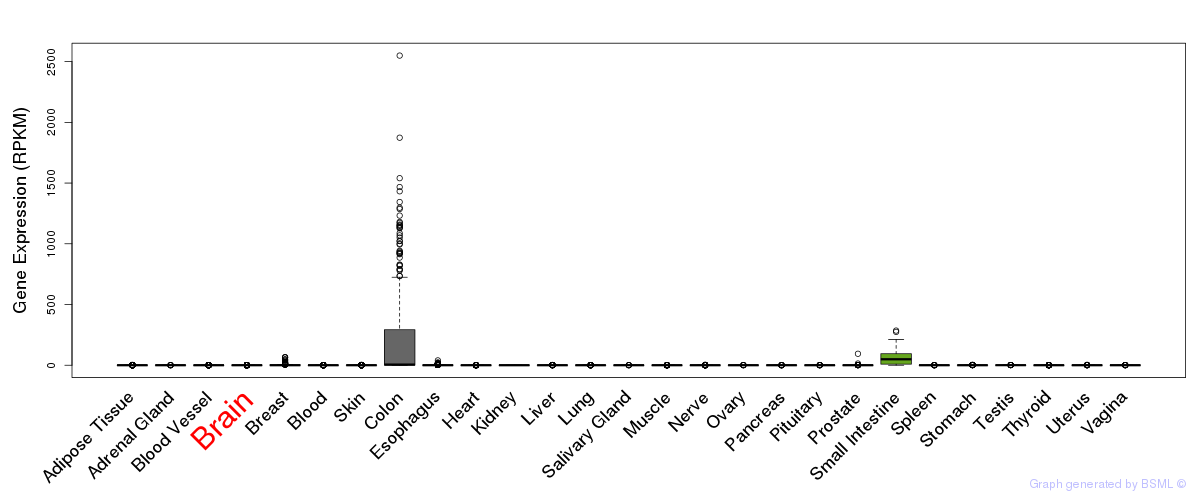
General gene expression (GTEx)
Gene expression of temporal and spatial changes (BrainSpan)
Footnote:
SC: sub-cortical regions; SM: sensory-motor regions; FC: frontal cortex; and TP: temporal-parietal cortex
ST1: fetal (13 - 26 postconception weeks), ST2: early infancy to late childhood (4 months to 11 years), and ST3: adolescence to adulthood (13 - 23 years)
The bar shown representes the lower 25% and upper 25% of the expression distribution.
Top co-expressed genes in brain regions
| Top 10 positively co-expressed genes | ||
| Gene | Pearson's Correlation | Spearman's Correlation |
| CADPS2 | 0.78 | 0.60 |
| ZNF365 | 0.77 | 0.59 |
| FBLN7 | 0.77 | 0.59 |
| RGS4 | 0.77 | 0.69 |
| SYT12 | 0.76 | 0.66 |
| HTR2A | 0.76 | 0.54 |
| KIAA0748 | 0.76 | 0.70 |
| SNAP25 | 0.75 | 0.55 |
| STEAP2 | 0.75 | 0.68 |
| ETS2 | 0.75 | 0.59 |
| Top 10 negatively co-expressed genes | ||
| Gene | Pearson's Correlation | Spearman's Correlation |
| FADS2 | -0.47 | -0.51 |
| BCL7C | -0.46 | -0.60 |
| PKN1 | -0.43 | -0.55 |
| TRAF4 | -0.43 | -0.63 |
| PDE9A | -0.42 | -0.58 |
| SH3BP2 | -0.41 | -0.59 |
| TUBB2B | -0.41 | -0.61 |
| SLC25A1 | -0.41 | -0.55 |
| KIAA1949 | -0.41 | -0.54 |
| GPR125 | -0.41 | -0.41 |
Section V. Pathway annotation
| Pathway name | Pathway size | # SZGR 2.0 genes in pathway | Info |
|---|---|---|---|
| REACTOME TRANSMEMBRANE TRANSPORT OF SMALL MOLECULES | 413 | 270 | All SZGR 2.0 genes in this pathway |
| REACTOME SLC MEDIATED TRANSMEMBRANE TRANSPORT | 241 | 157 | All SZGR 2.0 genes in this pathway |
| REACTOME TRANSPORT OF INORGANIC CATIONS ANIONS AND AMINO ACIDS OLIGOPEPTIDES | 94 | 65 | All SZGR 2.0 genes in this pathway |
| WATANABE COLON CANCER MSI VS MSS DN | 81 | 42 | All SZGR 2.0 genes in this pathway |
| SABATES COLORECTAL ADENOMA DN | 291 | 176 | All SZGR 2.0 genes in this pathway |
| DELYS THYROID CANCER UP | 443 | 294 | All SZGR 2.0 genes in this pathway |
| FARMER BREAST CANCER APOCRINE VS BASAL | 330 | 217 | All SZGR 2.0 genes in this pathway |
| SHETH LIVER CANCER VS TXNIP LOSS PAM4 | 261 | 153 | All SZGR 2.0 genes in this pathway |
| KONDO PROSTATE CANCER WITH H3K27ME3 | 196 | 93 | All SZGR 2.0 genes in this pathway |
| MCCABE BOUND BY HOXC6 | 469 | 239 | All SZGR 2.0 genes in this pathway |
| ACEVEDO METHYLATED IN LIVER CANCER DN | 940 | 425 | All SZGR 2.0 genes in this pathway |
| SMID BREAST CANCER LUMINAL A UP | 84 | 52 | All SZGR 2.0 genes in this pathway |
| SMID BREAST CANCER BASAL DN | 701 | 446 | All SZGR 2.0 genes in this pathway |
| YAUCH HEDGEHOG SIGNALING PARACRINE UP | 149 | 85 | All SZGR 2.0 genes in this pathway |
| FEVR CTNNB1 TARGETS UP | 682 | 433 | All SZGR 2.0 genes in this pathway |
| ACEVEDO FGFR1 TARGETS IN PROSTATE CANCER MODEL DN | 308 | 187 | All SZGR 2.0 genes in this pathway |