Gene Page: FRMPD1
Summary ?
| GeneID | 22844 |
| Symbol | FRMPD1 |
| Synonyms | FRMD2 |
| Description | FERM and PDZ domain containing 1 |
| Reference | HGNC:HGNC:29159|Ensembl:ENSG00000070601|HPRD:17018|Vega:OTTHUMG00000019927 |
| Gene type | protein-coding |
| Map location | 9p13.2 |
| Pascal p-value | 0.178 |
| Fetal beta | -1.228 |
| DMG | 1 (# studies) |
Gene in Data Sources
| Gene set name | Method of gene set | Description | Info |
|---|---|---|---|
| CV:GWASdb | Genome-wide Association Studies | GWASdb records for schizophrenia | |
| CV:PGCnp | Genome-wide Association Study | GWAS | |
| DMG:Nishioka_2013 | Genome-wide DNA methylation analysis | The authors investigated the methylation profiles of DNA in peripheral blood cells from 18 patients with first-episode schizophrenia (FESZ) and from 15 normal controls. | 1 |
Section I. Genetics and epigenetics annotation
 Differentially methylated gene
| Probe | Chromosome | Position | Nearest gene | P (dis) | Beta (dis) | FDR (dis) | Study |
|---|---|---|---|---|---|---|---|
| cg16235034 | 9 | 37650629 | FRMPD1 | -0.021 | 0.88 | DMG:Nishioka_2013 |
Section II. Transcriptome annotation
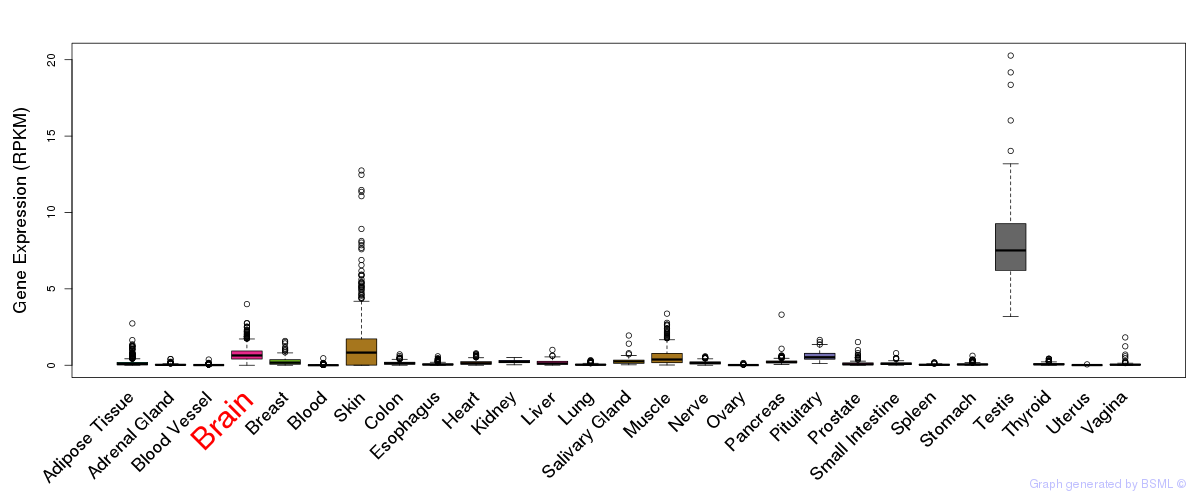
General gene expression (GTEx)
Gene expression during devlopment (BrainCloud)
Footnote:
A total of 269 time points ploted, with n=38 fetal samples (x=1:38). Each triangle represents one time point.
Gene expression of temporal and spatial changes (BrainSpan)
Footnote:
SC: sub-cortical regions; SM: sensory-motor regions; FC: frontal cortex; and TP: temporal-parietal cortex
ST1: fetal (13 - 26 postconception weeks), ST2: early infancy to late childhood (4 months to 11 years), and ST3: adolescence to adulthood (13 - 23 years)
The bar shown representes the lower 25% and upper 25% of the expression distribution.
Top co-expressed genes in brain regions
| Top 10 positively co-expressed genes | ||
| Gene | Pearson's Correlation | Spearman's Correlation |
| SH3PXD2B | 0.87 | 0.88 |
| PTGFRN | 0.87 | 0.92 |
| ANKS1A | 0.86 | 0.90 |
| KIRREL | 0.85 | 0.86 |
| PCDHB3 | 0.85 | 0.89 |
| C20orf94 | 0.85 | 0.89 |
| FAM115A | 0.84 | 0.94 |
| KLF12 | 0.84 | 0.89 |
| DNMT3A | 0.84 | 0.88 |
| RYBP | 0.84 | 0.93 |
| Top 10 negatively co-expressed genes | ||
| Gene | Pearson's Correlation | Spearman's Correlation |
| AF347015.31 | -0.57 | -0.85 |
| C5orf53 | -0.57 | -0.74 |
| MT-CO2 | -0.56 | -0.87 |
| AF347015.27 | -0.56 | -0.83 |
| AF347015.33 | -0.55 | -0.82 |
| FXYD1 | -0.54 | -0.82 |
| S100B | -0.54 | -0.78 |
| MT-CYB | -0.54 | -0.82 |
| AF347015.8 | -0.54 | -0.84 |
| AIFM3 | -0.53 | -0.70 |
Section V. Pathway annotation
| Pathway name | Pathway size | # SZGR 2.0 genes in pathway | Info |
|---|---|---|---|
| DAVICIONI MOLECULAR ARMS VS ERMS UP | 332 | 228 | All SZGR 2.0 genes in this pathway |
| BENPORATH SUZ12 TARGETS | 1038 | 678 | All SZGR 2.0 genes in this pathway |
| BENPORATH ES WITH H3K27ME3 | 1118 | 744 | All SZGR 2.0 genes in this pathway |
| ACEVEDO METHYLATED IN LIVER CANCER DN | 940 | 425 | All SZGR 2.0 genes in this pathway |
| SMID BREAST CANCER RELAPSE IN PLEURA DN | 27 | 15 | All SZGR 2.0 genes in this pathway |
| YAGI AML WITH T 9 11 TRANSLOCATION | 130 | 87 | All SZGR 2.0 genes in this pathway |
| ZWANG TRANSIENTLY UP BY 2ND EGF PULSE ONLY | 1725 | 838 | All SZGR 2.0 genes in this pathway |