Gene Page: ZNF510
Summary ?
| GeneID | 22869 |
| Symbol | ZNF510 |
| Synonyms | - |
| Description | zinc finger protein 510 |
| Reference | HGNC:HGNC:29161|Ensembl:ENSG00000081386|HPRD:18348|Vega:OTTHUMG00000020303 |
| Gene type | protein-coding |
| Map location | 9q22.33 |
| Pascal p-value | 0.334 |
| Sherlock p-value | 0.043 |
| Fetal beta | 0.84 |
| eGene | Myers' cis & trans |
Gene in Data Sources
| Gene set name | Method of gene set | Description | Info |
|---|---|---|---|
| CV:PGCnp | Genome-wide Association Study | GWAS |
Section I. Genetics and epigenetics annotation
 eQTL annotation
| SNP ID | Chromosome | Position | eGene | Gene Entrez ID | pvalue | qvalue | TSS distance | eQTL type |
|---|---|---|---|---|---|---|---|---|
| rs10193163 | chr2 | 79352536 | ZNF510 | 22869 | 0.19 | trans |
Section II. Transcriptome annotation
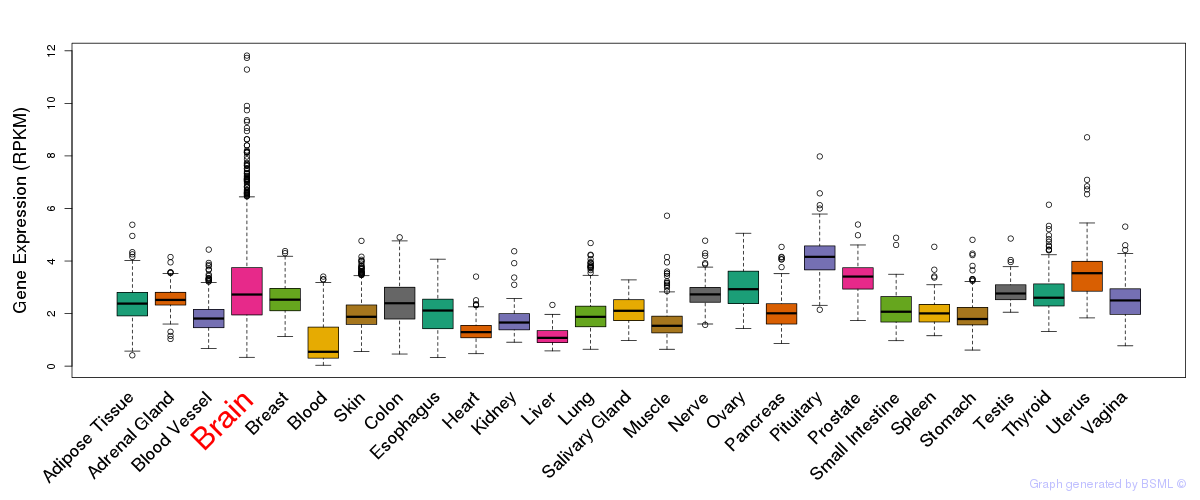
General gene expression (GTEx)
Gene expression during devlopment (BrainCloud)
Footnote:
A total of 269 time points ploted, with n=38 fetal samples (x=1:38). Each triangle represents one time point.
Gene expression of temporal and spatial changes (BrainSpan)
Footnote:
SC: sub-cortical regions; SM: sensory-motor regions; FC: frontal cortex; and TP: temporal-parietal cortex
ST1: fetal (13 - 26 postconception weeks), ST2: early infancy to late childhood (4 months to 11 years), and ST3: adolescence to adulthood (13 - 23 years)
The bar shown representes the lower 25% and upper 25% of the expression distribution.
Top co-expressed genes in brain regions
| Top 10 positively co-expressed genes | ||
| Gene | Pearson's Correlation | Spearman's Correlation |
| CNNM2 | 0.88 | 0.90 |
| FAM55C | 0.87 | 0.90 |
| MPRIP | 0.87 | 0.90 |
| TRAPPC10 | 0.86 | 0.91 |
| CLCN6 | 0.86 | 0.89 |
| MTOR | 0.85 | 0.89 |
| SLC4A8 | 0.85 | 0.88 |
| LARP1 | 0.85 | 0.88 |
| USP31 | 0.84 | 0.86 |
| TGOLN2 | 0.84 | 0.87 |
| Top 10 negatively co-expressed genes | ||
| Gene | Pearson's Correlation | Spearman's Correlation |
| DBI | -0.58 | -0.68 |
| RHOC | -0.58 | -0.65 |
| GNG11 | -0.57 | -0.67 |
| C1orf54 | -0.56 | -0.69 |
| C1orf61 | -0.56 | -0.70 |
| S100A16 | -0.55 | -0.60 |
| AF347015.21 | -0.55 | -0.62 |
| PSME2 | -0.53 | -0.57 |
| ENHO | -0.53 | -0.59 |
| HIGD1B | -0.53 | -0.59 |
Section V. Pathway annotation
| Pathway name | Pathway size | # SZGR 2.0 genes in pathway | Info |
|---|---|---|---|
| REACTOME GENERIC TRANSCRIPTION PATHWAY | 352 | 181 | All SZGR 2.0 genes in this pathway |
| DACOSTA UV RESPONSE VIA ERCC3 UP | 309 | 199 | All SZGR 2.0 genes in this pathway |
| PUJANA ATM PCC NETWORK | 1442 | 892 | All SZGR 2.0 genes in this pathway |
| VERHAAK GLIOBLASTOMA PRONEURAL | 177 | 132 | All SZGR 2.0 genes in this pathway |
| ZWANG DOWN BY 2ND EGF PULSE | 293 | 119 | All SZGR 2.0 genes in this pathway |