Gene Page: UBOX5
Summary ?
| GeneID | 22888 |
| Symbol | UBOX5 |
| Synonyms | RNF37|UBCE7IP5|UIP5|hUIP5 |
| Description | U-box domain containing 5 |
| Reference | HGNC:HGNC:17777|Ensembl:ENSG00000185019|HPRD:15605|Vega:OTTHUMG00000031731 |
| Gene type | protein-coding |
| Map location | 20p13 |
| Pascal p-value | 0.577 |
| Fetal beta | -0.736 |
| DMG | 1 (# studies) |
| eGene | Cerebellum Myers' cis & trans |
Gene in Data Sources
| Gene set name | Method of gene set | Description | Info |
|---|---|---|---|
| CV:PGCnp | Genome-wide Association Study | GWAS | |
| DMG:Jaffe_2016 | Genome-wide DNA methylation analysis | This dataset includes 2,104 probes/CpGs associated with SZ patients (n=108) compared to 136 controls at Bonferroni-adjusted P < 0.05. | 2 |
| DMG:Wockner_2014 | Genome-wide DNA methylation analysis | This dataset includes 4641 differentially methylated probes corresponding to 2929 unique genes between schizophrenia patients (n=24) and controls (n=24). | 2 |
Section I. Genetics and epigenetics annotation
 Differentially methylated gene
| Probe | Chromosome | Position | Nearest gene | P (dis) | Beta (dis) | FDR (dis) | Study |
|---|---|---|---|---|---|---|---|
| cg03183872 | 20 | 3140552 | FASTKD5;UBOX5 | 1.554E-4 | -0.294 | 0.032 | DMG:Wockner_2014 |
| cg15645079 | 20 | 3140569 | UBOX5 | 8.45E-10 | -0.011 | 1.08E-6 | DMG:Jaffe_2016 |
eQTL annotation
| SNP ID | Chromosome | Position | eGene | Gene Entrez ID | pvalue | qvalue | TSS distance | eQTL type |
|---|---|---|---|---|---|---|---|---|
| rs2166458 | chr2 | 215716168 | UBOX5 | 22888 | 0.19 | trans |
Section II. Transcriptome annotation
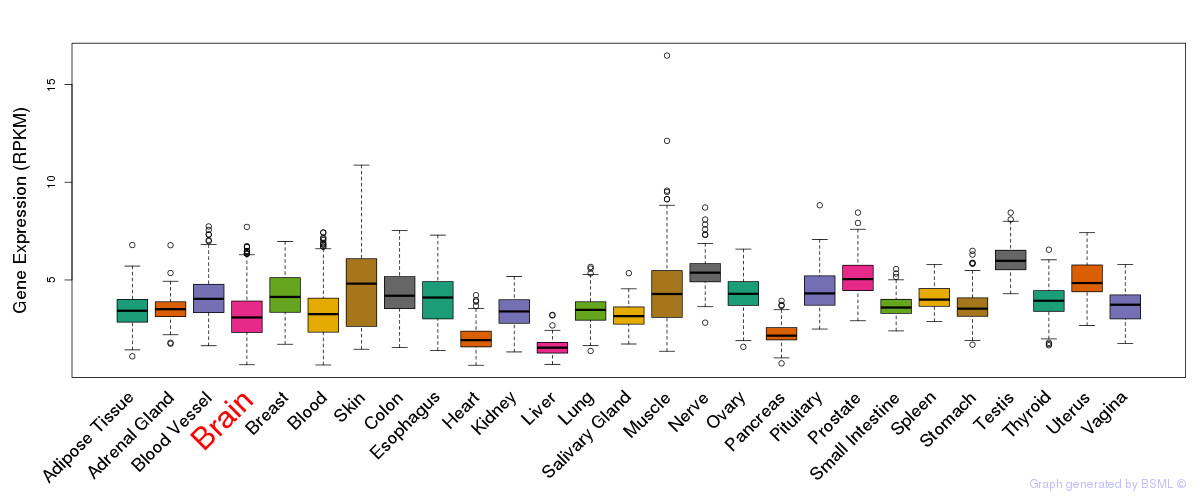
General gene expression (GTEx)
Gene expression during devlopment (BrainCloud)
Footnote:
A total of 269 time points ploted, with n=38 fetal samples (x=1:38). Each triangle represents one time point.
Gene expression of temporal and spatial changes (BrainSpan)
Footnote:
SC: sub-cortical regions; SM: sensory-motor regions; FC: frontal cortex; and TP: temporal-parietal cortex
ST1: fetal (13 - 26 postconception weeks), ST2: early infancy to late childhood (4 months to 11 years), and ST3: adolescence to adulthood (13 - 23 years)
The bar shown representes the lower 25% and upper 25% of the expression distribution.
Top co-expressed genes in brain regions
| Top 10 positively co-expressed genes | ||
| Gene | Pearson's Correlation | Spearman's Correlation |
| KDM3B | 0.93 | 0.93 |
| NUP98 | 0.93 | 0.94 |
| GCN1L1 | 0.93 | 0.92 |
| KIAA0355 | 0.93 | 0.93 |
| ANKFY1 | 0.93 | 0.94 |
| VEZF1 | 0.93 | 0.93 |
| HEATR6 | 0.92 | 0.92 |
| LIG3 | 0.92 | 0.91 |
| CRKRS | 0.92 | 0.93 |
| ABL1 | 0.92 | 0.93 |
| Top 10 negatively co-expressed genes | ||
| Gene | Pearson's Correlation | Spearman's Correlation |
| AF347015.31 | -0.69 | -0.80 |
| MT-CO2 | -0.68 | -0.79 |
| IFI27 | -0.67 | -0.77 |
| AF347015.21 | -0.66 | -0.84 |
| FXYD1 | -0.66 | -0.76 |
| CXCL14 | -0.66 | -0.77 |
| HIGD1B | -0.66 | -0.78 |
| C5orf53 | -0.64 | -0.67 |
| C1orf54 | -0.64 | -0.80 |
| MYL3 | -0.63 | -0.75 |
Section V. Pathway annotation
| Pathway name | Pathway size | # SZGR 2.0 genes in pathway | Info |
|---|---|---|---|
| KEGG UBIQUITIN MEDIATED PROTEOLYSIS | 138 | 98 | All SZGR 2.0 genes in this pathway |
| REACTOME IMMUNE SYSTEM | 933 | 616 | All SZGR 2.0 genes in this pathway |
| REACTOME ADAPTIVE IMMUNE SYSTEM | 539 | 350 | All SZGR 2.0 genes in this pathway |
| REACTOME CLASS I MHC MEDIATED ANTIGEN PROCESSING PRESENTATION | 251 | 156 | All SZGR 2.0 genes in this pathway |
| REACTOME ANTIGEN PROCESSING UBIQUITINATION PROTEASOME DEGRADATION | 212 | 129 | All SZGR 2.0 genes in this pathway |
| GROSS HYPOXIA VIA ELK3 UP | 209 | 139 | All SZGR 2.0 genes in this pathway |
| GROSS HYPOXIA VIA ELK3 ONLY DN | 44 | 30 | All SZGR 2.0 genes in this pathway |
| KUMAR PATHOGEN LOAD BY MACROPHAGES | 275 | 155 | All SZGR 2.0 genes in this pathway |
| HOLLEMAN ASPARAGINASE RESISTANCE ALL UP | 22 | 14 | All SZGR 2.0 genes in this pathway |