Gene Page: IQSEC2
Summary ?
| GeneID | 23096 |
| Symbol | IQSEC2 |
| Synonyms | BRAG1|MRX1 |
| Description | IQ motif and Sec7 domain 2 |
| Reference | MIM:300522|HGNC:HGNC:29059|Ensembl:ENSG00000124313|HPRD:10012|Vega:OTTHUMG00000021608 |
| Gene type | protein-coding |
| Map location | Xp11.22 |
| Fetal beta | -0.278 |
| Support | INTRACELLULAR SIGNAL TRANSDUCTION G2Cdb.human_BAYES-COLLINS-HUMAN-PSD-CONSENSUS G2Cdb.human_BAYES-COLLINS-HUMAN-PSD-FULL G2Cdb.human_BAYES-COLLINS-MOUSE-PSD-CONSENSUS G2Cdb.human_TAP-PSD-95-CORE G2Cdb.humanPSD G2Cdb.humanPSP CompositeSet Darnell FMRP targets Potential synaptic genes |
Gene in Data Sources
| Gene set name | Method of gene set | Description | Info |
|---|---|---|---|
| CV:GWASdb | Genome-wide Association Studies | GWASdb records for schizophrenia | |
| CV:PGCnp | Genome-wide Association Study | GWAS |
Section I. Genetics and epigenetics annotation
Section II. Transcriptome annotation
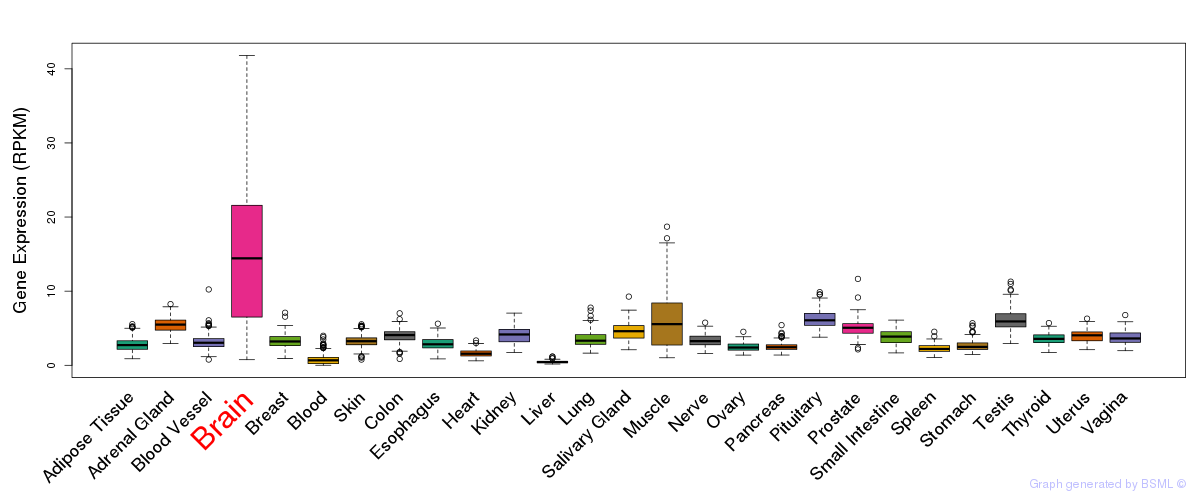
General gene expression (GTEx)
Gene expression during devlopment (BrainCloud)
Footnote:
A total of 269 time points ploted, with n=38 fetal samples (x=1:38). Each triangle represents one time point.
Gene expression of temporal and spatial changes (BrainSpan)
Footnote:
SC: sub-cortical regions; SM: sensory-motor regions; FC: frontal cortex; and TP: temporal-parietal cortex
ST1: fetal (13 - 26 postconception weeks), ST2: early infancy to late childhood (4 months to 11 years), and ST3: adolescence to adulthood (13 - 23 years)
The bar shown representes the lower 25% and upper 25% of the expression distribution.
Top co-expressed genes in brain regions
| Top 10 positively co-expressed genes | ||
| Gene | Pearson's Correlation | Spearman's Correlation |
| TGOLN2 | 0.93 | 0.94 |
| ATG2B | 0.93 | 0.94 |
| USP32 | 0.91 | 0.91 |
| ENTPD4 | 0.91 | 0.92 |
| VPS13D | 0.91 | 0.92 |
| BTBD9 | 0.91 | 0.91 |
| TRAPPC10 | 0.91 | 0.92 |
| PLEKHM3 | 0.91 | 0.92 |
| PHLPP2 | 0.91 | 0.92 |
| DMXL2 | 0.91 | 0.91 |
| Top 10 negatively co-expressed genes | ||
| Gene | Pearson's Correlation | Spearman's Correlation |
| AF347015.21 | -0.60 | -0.56 |
| C1orf54 | -0.57 | -0.63 |
| HIGD1B | -0.56 | -0.56 |
| C1orf61 | -0.55 | -0.66 |
| AF347015.31 | -0.55 | -0.52 |
| GNG11 | -0.55 | -0.56 |
| DBI | -0.55 | -0.61 |
| MT-CO2 | -0.55 | -0.53 |
| C16orf74 | -0.54 | -0.58 |
| IL32 | -0.54 | -0.52 |
Section V. Pathway annotation
| Pathway name | Pathway size | # SZGR 2.0 genes in pathway | Info |
|---|---|---|---|
| KEGG ENDOCYTOSIS | 183 | 132 | All SZGR 2.0 genes in this pathway |
| NAKAMURA TUMOR ZONE PERIPHERAL VS CENTRAL DN | 634 | 384 | All SZGR 2.0 genes in this pathway |
| KIM WT1 TARGETS DN | 459 | 276 | All SZGR 2.0 genes in this pathway |
| FOSTER TOLERANT MACROPHAGE UP | 156 | 92 | All SZGR 2.0 genes in this pathway |
| FOSTER TOLERANT MACROPHAGE DN | 409 | 268 | All SZGR 2.0 genes in this pathway |
| MILI PSEUDOPODIA HAPTOTAXIS UP | 518 | 299 | All SZGR 2.0 genes in this pathway |
| MIKKELSEN MCV6 LCP WITH H3K4ME3 | 162 | 80 | All SZGR 2.0 genes in this pathway |
| MIKKELSEN MEF LCP WITH H3K4ME3 | 128 | 68 | All SZGR 2.0 genes in this pathway |
| BROWNE HCMV INFECTION 1HR DN | 222 | 147 | All SZGR 2.0 genes in this pathway |
| ZWANG TRANSIENTLY UP BY 2ND EGF PULSE ONLY | 1725 | 838 | All SZGR 2.0 genes in this pathway |