Gene Page: COLGALT2
Summary ?
| GeneID | 23127 |
| Symbol | COLGALT2 |
| Synonyms | C1orf17|GLT25D2 |
| Description | collagen beta(1-O)galactosyltransferase 2 |
| Reference | HGNC:HGNC:16790|Ensembl:ENSG00000198756|HPRD:13583|Vega:OTTHUMG00000035460 |
| Gene type | protein-coding |
| Map location | 1q25 |
| DMG | 1 (# studies) |
| eGene | Caudate basal ganglia Cerebellum Hippocampus Putamen basal ganglia |
Gene in Data Sources
| Gene set name | Method of gene set | Description | Info |
|---|---|---|---|
| CV:PGCnp | Genome-wide Association Study | GWAS | |
| CV:PheWAS | Phenome-wide association studies (PheWAS) | 157 SNPs associated with schizophrenia | 0 |
| DMG:Jaffe_2016 | Genome-wide DNA methylation analysis | This dataset includes 2,104 probes/CpGs associated with SZ patients (n=108) compared to 136 controls at Bonferroni-adjusted P < 0.05. | 1 |
Section I. Genetics and epigenetics annotation
 CV:PheWAS
| SNP ID | Chromosome | Position | Allele | P | Function | Gene | Up/Down Distance |
|---|
Differentially methylated gene
| Probe | Chromosome | Position | Nearest gene | P (dis) | Beta (dis) | FDR (dis) | Study |
|---|---|---|---|---|---|---|---|
| cg16655084 | 1 | 184005896 | COLGALT2 | 5.64E-9 | -0.017 | 3.08E-6 | DMG:Jaffe_2016 |
eQTL annotation
| SNP ID | Chromosome | Position | eGene | Gene Entrez ID | pvalue | qvalue | TSS distance | eQTL type |
|---|---|---|---|---|---|---|---|---|
| rs7524554 | 1 | 183933971 | COLGALT2 | ENSG00000198756.6 | 5.13983E-6 | 0.02 | 72892 | gtex_brain_putamen_basal |
| rs2378793 | 1 | 183934680 | COLGALT2 | ENSG00000198756.6 | 5.10588E-6 | 0.02 | 72183 | gtex_brain_putamen_basal |
| rs7539021 | 1 | 183935831 | COLGALT2 | ENSG00000198756.6 | 1.39498E-6 | 0.02 | 71032 | gtex_brain_putamen_basal |
| rs3925148 | 1 | 183938883 | COLGALT2 | ENSG00000198756.6 | 4.98485E-6 | 0.02 | 67980 | gtex_brain_putamen_basal |
| rs10752925 | 1 | 183939299 | COLGALT2 | ENSG00000198756.6 | 4.98406E-6 | 0.02 | 67564 | gtex_brain_putamen_basal |
| rs10752926 | 1 | 183939424 | COLGALT2 | ENSG00000198756.6 | 4.98367E-6 | 0.02 | 67439 | gtex_brain_putamen_basal |
| rs7515190 | 1 | 183940314 | COLGALT2 | ENSG00000198756.6 | 4.80844E-6 | 0.02 | 66549 | gtex_brain_putamen_basal |
Section II. Transcriptome annotation
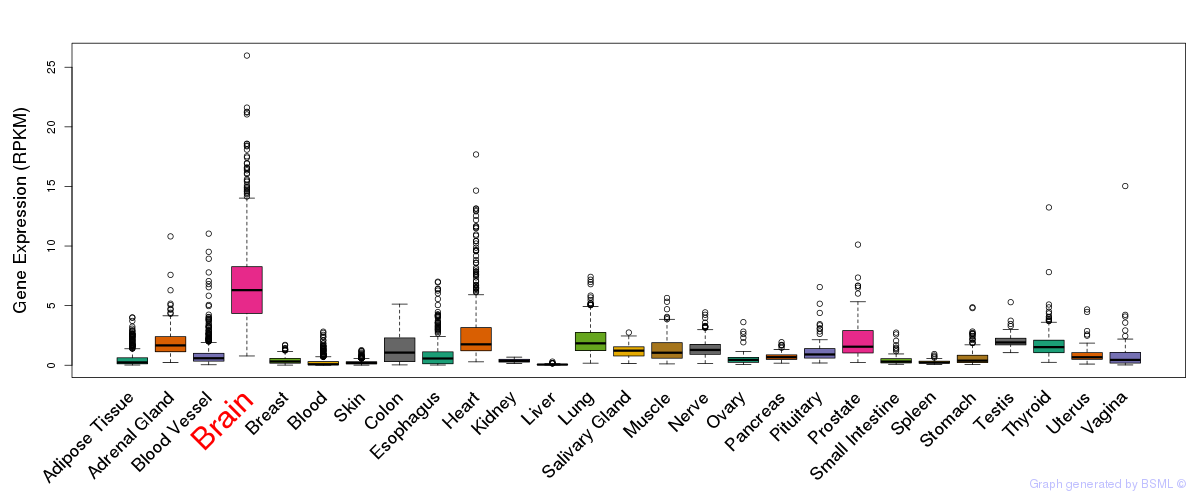
General gene expression (GTEx)
Gene expression of temporal and spatial changes (BrainSpan)
Footnote:
SC: sub-cortical regions; SM: sensory-motor regions; FC: frontal cortex; and TP: temporal-parietal cortex
ST1: fetal (13 - 26 postconception weeks), ST2: early infancy to late childhood (4 months to 11 years), and ST3: adolescence to adulthood (13 - 23 years)
The bar shown representes the lower 25% and upper 25% of the expression distribution.