Gene Page: MBLAC1
Summary ?
| GeneID | 255374 |
| Symbol | MBLAC1 |
| Synonyms | - |
| Description | metallo-beta-lactamase domain containing 1 |
| Reference | HGNC:HGNC:22180|Ensembl:ENSG00000214309|HPRD:18584|Vega:OTTHUMG00000154846 |
| Gene type | protein-coding |
| Map location | 7q22.1 |
| Pascal p-value | 0.354 |
| Fetal beta | -0.916 |
| DMG | 1 (# studies) |
| eGene | Caudate basal ganglia Cerebellar Hemisphere Cerebellum Cortex Frontal Cortex BA9 Myers' cis & trans |
Gene in Data Sources
| Gene set name | Method of gene set | Description | Info |
|---|---|---|---|
| CV:PGCnp | Genome-wide Association Study | GWAS | |
| DMG:Wockner_2014 | Genome-wide DNA methylation analysis | This dataset includes 4641 differentially methylated probes corresponding to 2929 unique genes between schizophrenia patients (n=24) and controls (n=24). | 1 |
Section I. Genetics and epigenetics annotation
 Differentially methylated gene
| Probe | Chromosome | Position | Nearest gene | P (dis) | Beta (dis) | FDR (dis) | Study |
|---|---|---|---|---|---|---|---|
| cg24109116 | 7 | 99725975 | MBLAC1 | 5.258E-4 | 0.46 | 0.048 | DMG:Wockner_2014 |
eQTL annotation
| SNP ID | Chromosome | Position | eGene | Gene Entrez ID | pvalue | qvalue | TSS distance | eQTL type |
|---|---|---|---|---|---|---|---|---|
| rs2289237 | chr2 | 86266273 | MBLAC1 | 255374 | 0.1 | trans | ||
| rs17584578 | chr2 | 86307623 | MBLAC1 | 255374 | 0.03 | trans | ||
| rs2303340 | chr2 | 86333192 | MBLAC1 | 255374 | 0.03 | trans | ||
| rs2303339 | chr2 | 86346179 | MBLAC1 | 255374 | 0.03 | trans | ||
| rs3770066 | chr2 | 86392349 | MBLAC1 | 255374 | 0.03 | trans | ||
| rs12617962 | chr2 | 86513101 | MBLAC1 | 255374 | 0.02 | trans |
Section II. Transcriptome annotation
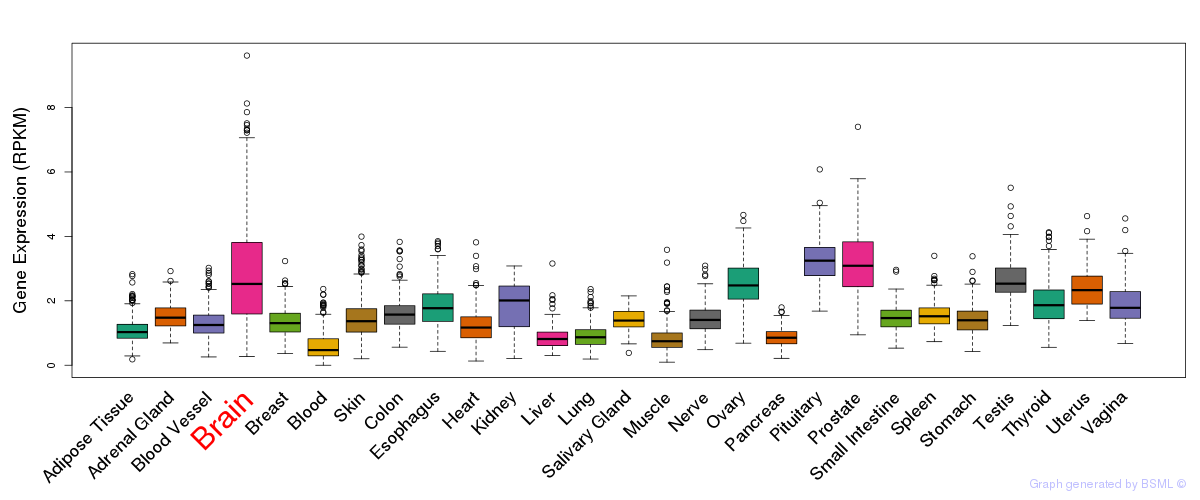
General gene expression (GTEx)
Gene expression during devlopment (BrainCloud)
Footnote:
A total of 269 time points ploted, with n=38 fetal samples (x=1:38). Each triangle represents one time point.
Gene expression of temporal and spatial changes (BrainSpan)
Footnote:
SC: sub-cortical regions; SM: sensory-motor regions; FC: frontal cortex; and TP: temporal-parietal cortex
ST1: fetal (13 - 26 postconception weeks), ST2: early infancy to late childhood (4 months to 11 years), and ST3: adolescence to adulthood (13 - 23 years)
The bar shown representes the lower 25% and upper 25% of the expression distribution.
No co-expressed genes in brain regions
Section V. Pathway annotation
| Pathway name | Pathway size | # SZGR 2.0 genes in pathway | Info |
|---|---|---|---|
| SHEPARD CRUSH AND BURN MUTANT UP | 197 | 110 | All SZGR 2.0 genes in this pathway |
| IWANAGA CARCINOGENESIS BY KRAS PTEN DN | 353 | 226 | All SZGR 2.0 genes in this pathway |
| RAO BOUND BY SALL4 ISOFORM A | 182 | 108 | All SZGR 2.0 genes in this pathway |