Gene Page: PARS2
Summary ?
| GeneID | 25973 |
| Symbol | PARS2 |
| Synonyms | MT-PRORS|proRS |
| Description | prolyl-tRNA synthetase 2, mitochondrial (putative) |
| Reference | MIM:612036|HGNC:HGNC:30563|Ensembl:ENSG00000162396|HPRD:13220|Vega:OTTHUMG00000009915 |
| Gene type | protein-coding |
| Map location | 1p32.2 |
| Pascal p-value | 0.286 |
| Fetal beta | -0.418 |
| DMG | 1 (# studies) |
| Support | Ascano FMRP targets |
Gene in Data Sources
| Gene set name | Method of gene set | Description | Info |
|---|---|---|---|
| CV:GWASdb | Genome-wide Association Studies | GWASdb records for schizophrenia | |
| CV:PGCnp | Genome-wide Association Study | GWAS | |
| DMG:Nishioka_2013 | Genome-wide DNA methylation analysis | The authors investigated the methylation profiles of DNA in peripheral blood cells from 18 patients with first-episode schizophrenia (FESZ) and from 15 normal controls. | 1 |
Section I. Genetics and epigenetics annotation
 Differentially methylated gene
| Probe | Chromosome | Position | Nearest gene | P (dis) | Beta (dis) | FDR (dis) | Study |
|---|---|---|---|---|---|---|---|
| cg10322308 | 1 | 55229957 | PARS2 | -0.026 | 0.34 | DMG:Nishioka_2013 |
Section II. Transcriptome annotation
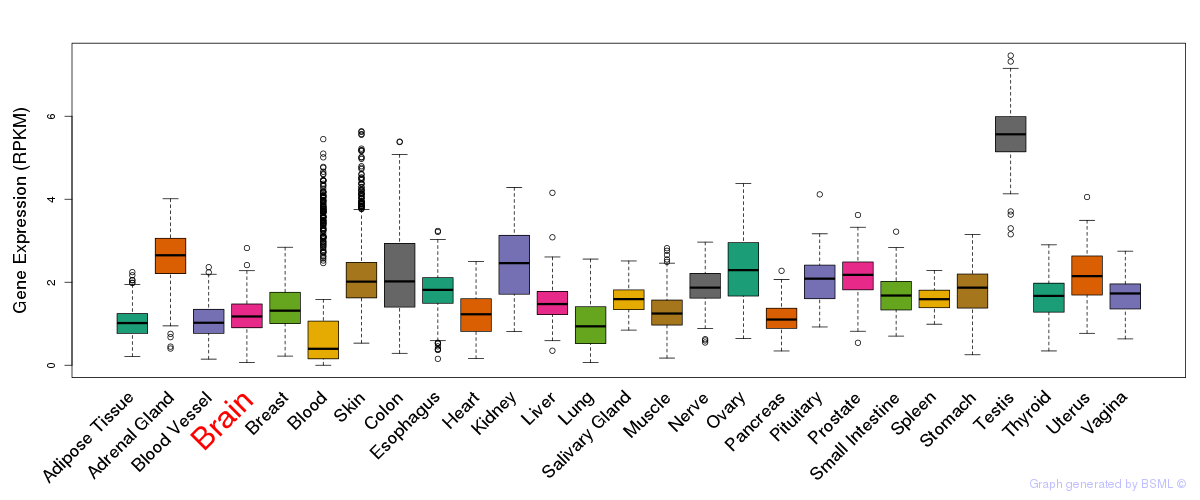
General gene expression (GTEx)
Gene expression during devlopment (BrainCloud)
Footnote:
A total of 269 time points ploted, with n=38 fetal samples (x=1:38). Each triangle represents one time point.
Gene expression of temporal and spatial changes (BrainSpan)
Footnote:
SC: sub-cortical regions; SM: sensory-motor regions; FC: frontal cortex; and TP: temporal-parietal cortex
ST1: fetal (13 - 26 postconception weeks), ST2: early infancy to late childhood (4 months to 11 years), and ST3: adolescence to adulthood (13 - 23 years)
The bar shown representes the lower 25% and upper 25% of the expression distribution.
Top co-expressed genes in brain regions
| Top 10 positively co-expressed genes | ||
| Gene | Pearson's Correlation | Spearman's Correlation |
| TRIM23 | 0.91 | 0.92 |
| APPL1 | 0.90 | 0.90 |
| PPP6C | 0.89 | 0.87 |
| SLC35A5 | 0.89 | 0.88 |
| RPRD1A | 0.89 | 0.88 |
| GRSF1 | 0.89 | 0.87 |
| MUDENG | 0.88 | 0.88 |
| KIAA1715 | 0.88 | 0.89 |
| CAB39 | 0.88 | 0.88 |
| AKAP10 | 0.88 | 0.87 |
| Top 10 negatively co-expressed genes | ||
| Gene | Pearson's Correlation | Spearman's Correlation |
| AF347015.21 | -0.63 | -0.51 |
| FXYD1 | -0.61 | -0.56 |
| MT-CO2 | -0.59 | -0.53 |
| IL32 | -0.59 | -0.53 |
| AC098691.2 | -0.58 | -0.57 |
| PLA2G5 | -0.57 | -0.56 |
| AF347015.8 | -0.57 | -0.52 |
| AF347015.18 | -0.56 | -0.53 |
| HIGD1B | -0.56 | -0.52 |
| EIF4EBP3 | -0.56 | -0.60 |
Section V. Pathway annotation
| Pathway name | Pathway size | # SZGR 2.0 genes in pathway | Info |
|---|---|---|---|
| KEGG AMINOACYL TRNA BIOSYNTHESIS | 41 | 33 | All SZGR 2.0 genes in this pathway |
| REACTOME MITOCHONDRIAL TRNA AMINOACYLATION | 21 | 17 | All SZGR 2.0 genes in this pathway |
| REACTOME TRNA AMINOACYLATION | 42 | 34 | All SZGR 2.0 genes in this pathway |
| MARSON BOUND BY E2F4 UNSTIMULATED | 728 | 415 | All SZGR 2.0 genes in this pathway |
| KUMAR PATHOGEN LOAD BY MACROPHAGES | 275 | 155 | All SZGR 2.0 genes in this pathway |