Gene Page: KCNG2
Summary ?
| GeneID | 26251 |
| Symbol | KCNG2 |
| Synonyms | KCNF2|KV6.2 |
| Description | potassium voltage-gated channel modifier subfamily G member 2 |
| Reference | MIM:605696|HGNC:HGNC:6249|Ensembl:ENSG00000178342|HPRD:12036|Vega:OTTHUMG00000044541 |
| Gene type | protein-coding |
| Map location | 18q23 |
| Pascal p-value | 1.57E-6 |
| Fetal beta | -0.329 |
| eGene | Caudate basal ganglia |
Gene in Data Sources
| Gene set name | Method of gene set | Description | Info |
|---|---|---|---|
| CV:GWASdb | Genome-wide Association Studies | GWASdb records for schizophrenia | |
| CV:PGCnp | Genome-wide Association Study | GWAS |
Section I. Genetics and epigenetics annotation
Section II. Transcriptome annotation
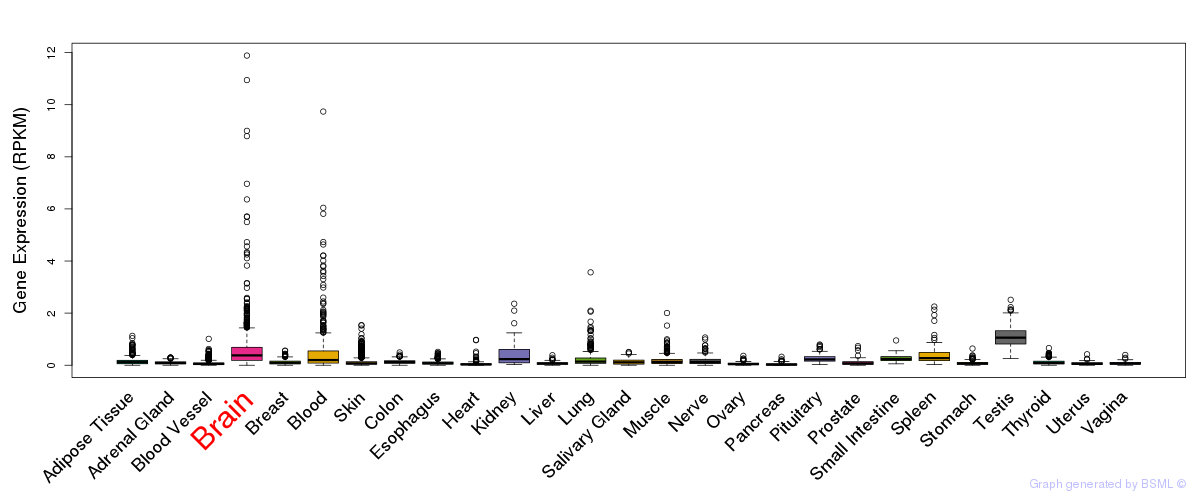
General gene expression (GTEx)
Gene expression during devlopment (BrainCloud)
Footnote:
A total of 269 time points ploted, with n=38 fetal samples (x=1:38). Each triangle represents one time point.
Gene expression of temporal and spatial changes (BrainSpan)
Footnote:
SC: sub-cortical regions; SM: sensory-motor regions; FC: frontal cortex; and TP: temporal-parietal cortex
ST1: fetal (13 - 26 postconception weeks), ST2: early infancy to late childhood (4 months to 11 years), and ST3: adolescence to adulthood (13 - 23 years)
The bar shown representes the lower 25% and upper 25% of the expression distribution.
Top co-expressed genes in brain regions
| Top 10 positively co-expressed genes | ||
| Gene | Pearson's Correlation | Spearman's Correlation |
| INPP5F | 0.88 | 0.89 |
| LMBR1 | 0.88 | 0.88 |
| OCRL | 0.87 | 0.88 |
| VPS35 | 0.87 | 0.87 |
| CAB39 | 0.87 | 0.88 |
| UBQLN1 | 0.87 | 0.87 |
| HIAT1 | 0.86 | 0.84 |
| LRPPRC | 0.86 | 0.86 |
| ARMC8 | 0.86 | 0.85 |
| C5orf22 | 0.86 | 0.86 |
| Top 10 negatively co-expressed genes | ||
| Gene | Pearson's Correlation | Spearman's Correlation |
| MT-CO2 | -0.69 | -0.65 |
| AF347015.21 | -0.69 | -0.63 |
| AF347015.31 | -0.67 | -0.63 |
| AF347015.8 | -0.66 | -0.63 |
| AF347015.2 | -0.66 | -0.61 |
| MT-CYB | -0.65 | -0.60 |
| HIGD1B | -0.65 | -0.62 |
| FXYD1 | -0.64 | -0.62 |
| AF347015.33 | -0.63 | -0.59 |
| PLA2G5 | -0.62 | -0.63 |
Section V. Pathway annotation
| Pathway name | Pathway size | # SZGR 2.0 genes in pathway | Info |
|---|---|---|---|
| REACTOME NEURONAL SYSTEM | 279 | 221 | All SZGR 2.0 genes in this pathway |
| REACTOME INTEGRATION OF ENERGY METABOLISM | 120 | 84 | All SZGR 2.0 genes in this pathway |
| REACTOME REGULATION OF INSULIN SECRETION BY GLUCAGON LIKE PEPTIDE1 | 43 | 28 | All SZGR 2.0 genes in this pathway |
| REACTOME REGULATION OF INSULIN SECRETION | 93 | 65 | All SZGR 2.0 genes in this pathway |
| REACTOME VOLTAGE GATED POTASSIUM CHANNELS | 43 | 32 | All SZGR 2.0 genes in this pathway |
| REACTOME POTASSIUM CHANNELS | 98 | 68 | All SZGR 2.0 genes in this pathway |