Gene Page: COMMD5
Summary ?
| GeneID | 28991 |
| Symbol | COMMD5 |
| Synonyms | HCARG|HT002 |
| Description | COMM domain containing 5 |
| Reference | MIM:608216|HGNC:HGNC:17902|Ensembl:ENSG00000170619|HPRD:16301|Vega:OTTHUMG00000165251 |
| Gene type | protein-coding |
| Map location | 8q24.3 |
| Pascal p-value | 0.041 |
| Sherlock p-value | 0.413 |
| Fetal beta | -0.699 |
| DMG | 2 (# studies) |
| eGene | Cerebellum Myers' cis & trans |
Gene in Data Sources
| Gene set name | Method of gene set | Description | Info |
|---|---|---|---|
| CV:PGCnp | Genome-wide Association Study | GWAS | |
| DMG:Jaffe_2016 | Genome-wide DNA methylation analysis | This dataset includes 2,104 probes/CpGs associated with SZ patients (n=108) compared to 136 controls at Bonferroni-adjusted P < 0.05. | 2 |
| DMG:Wockner_2014 | Genome-wide DNA methylation analysis | This dataset includes 4641 differentially methylated probes corresponding to 2929 unique genes between schizophrenia patients (n=24) and controls (n=24). | 2 |
Section I. Genetics and epigenetics annotation
 Differentially methylated gene
| Probe | Chromosome | Position | Nearest gene | P (dis) | Beta (dis) | FDR (dis) | Study |
|---|---|---|---|---|---|---|---|
| cg10719100 | 8 | 146078187 | COMMD5 | 2.3E-5 | -0.25 | 0.017 | DMG:Wockner_2014 |
| cg24648864 | 8 | 146078283 | COMMD5 | 3.72E-10 | -0.019 | 7.47E-7 | DMG:Jaffe_2016 |
eQTL annotation
| SNP ID | Chromosome | Position | eGene | Gene Entrez ID | pvalue | qvalue | TSS distance | eQTL type |
|---|---|---|---|---|---|---|---|---|
| rs16829545 | chr2 | 151977407 | COMMD5 | 28991 | 4.229E-9 | trans | ||
| rs7584986 | chr2 | 184111432 | COMMD5 | 28991 | 0 | trans | ||
| rs6797307 | chr3 | 8601563 | COMMD5 | 28991 | 0.12 | trans | ||
| rs17762315 | chr5 | 76807576 | COMMD5 | 28991 | 0.01 | trans | ||
| rs7787830 | chr7 | 98797019 | COMMD5 | 28991 | 0.03 | trans | ||
| rs11139334 | chr9 | 84209393 | COMMD5 | 28991 | 0.06 | trans | ||
| rs16955618 | chr15 | 29937543 | COMMD5 | 28991 | 5.513E-13 | trans |
Section II. Transcriptome annotation
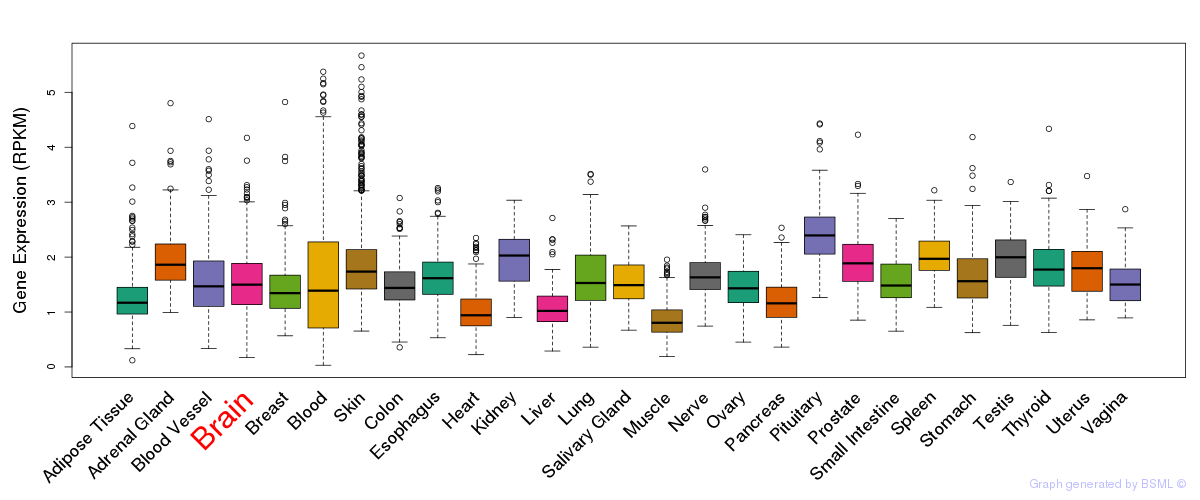
General gene expression (GTEx)
Gene expression during devlopment (BrainCloud)
Footnote:
A total of 269 time points ploted, with n=38 fetal samples (x=1:38). Each triangle represents one time point.
Gene expression of temporal and spatial changes (BrainSpan)
Footnote:
SC: sub-cortical regions; SM: sensory-motor regions; FC: frontal cortex; and TP: temporal-parietal cortex
ST1: fetal (13 - 26 postconception weeks), ST2: early infancy to late childhood (4 months to 11 years), and ST3: adolescence to adulthood (13 - 23 years)
The bar shown representes the lower 25% and upper 25% of the expression distribution.
No co-expressed genes in brain regions
Section V. Pathway annotation
| Pathway name | Pathway size | # SZGR 2.0 genes in pathway | Info |
|---|---|---|---|
| GARY CD5 TARGETS DN | 431 | 263 | All SZGR 2.0 genes in this pathway |
| VECCHI GASTRIC CANCER EARLY UP | 430 | 232 | All SZGR 2.0 genes in this pathway |
| NIKOLSKY BREAST CANCER 8Q23 Q24 AMPLICON | 157 | 87 | All SZGR 2.0 genes in this pathway |
| IVANOVA HEMATOPOIESIS LATE PROGENITOR | 544 | 307 | All SZGR 2.0 genes in this pathway |
| ZHANG BREAST CANCER PROGENITORS DN | 145 | 93 | All SZGR 2.0 genes in this pathway |
| JOHNSTONE PARVB TARGETS 2 DN | 336 | 211 | All SZGR 2.0 genes in this pathway |
| WAKABAYASHI ADIPOGENESIS PPARG BOUND 8D | 658 | 397 | All SZGR 2.0 genes in this pathway |