Gene Page: HBM
Summary ?
| GeneID | 3042 |
| Symbol | HBM |
| Synonyms | HBAP2|HBK |
| Description | hemoglobin subunit mu |
| Reference | MIM:609639|HGNC:HGNC:4826|Ensembl:ENSG00000206177|HPRD:13633|Vega:OTTHUMG00000059926 |
| Gene type | protein-coding |
| Map location | 16p13.3 |
| Pascal p-value | 0.242 |
| DMG | 1 (# studies) |
Gene in Data Sources
| Gene set name | Method of gene set | Description | Info |
|---|---|---|---|
| CV:PGCnp | Genome-wide Association Study | GWAS | |
| DMG:vanEijk_2014 | Genome-wide DNA methylation analysis | This dataset includes 432 differentially methylated CpG sites corresponding to 391 unique transcripts between schizophrenia patients (n=260) and unaffected controls (n=250). | 1 |
| PMID:cooccur | High-throughput literature-search | Systematic search in PubMed for genes co-occurring with SCZ keywords. A total of 3027 genes were included. | |
| Literature | High-throughput literature-search | Co-occurance with Schizophrenia keywords: schizophrenia,schizophrenias | Click to show details |
Section I. Genetics and epigenetics annotation
 Differentially methylated gene
| Probe | Chromosome | Position | Nearest gene | P (dis) | Beta (dis) | FDR (dis) | Study |
|---|---|---|---|---|---|---|---|
| cg01687051 | 16 | 278852 | HBM | 0.001 | -11.289 | DMG:vanEijk_2014 |
Section II. Transcriptome annotation
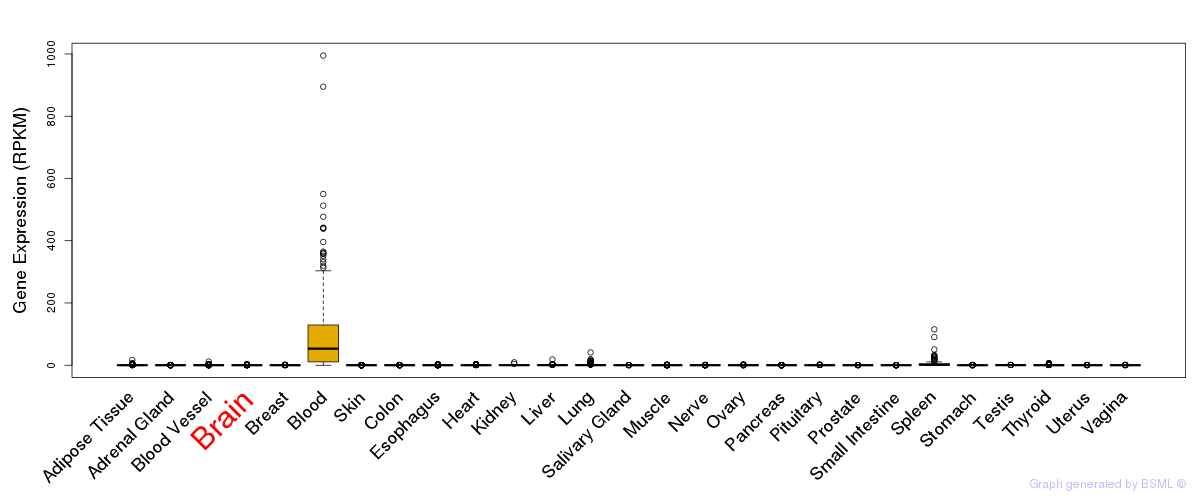
General gene expression (GTEx)
Gene expression of temporal and spatial changes (BrainSpan)
Footnote:
SC: sub-cortical regions; SM: sensory-motor regions; FC: frontal cortex; and TP: temporal-parietal cortex
ST1: fetal (13 - 26 postconception weeks), ST2: early infancy to late childhood (4 months to 11 years), and ST3: adolescence to adulthood (13 - 23 years)
The bar shown representes the lower 25% and upper 25% of the expression distribution.
Top co-expressed genes in brain regions
| Top 10 positively co-expressed genes | ||
| Gene | Pearson's Correlation | Spearman's Correlation |
| TBXAS1 | 0.82 | 0.81 |
| APBB1IP | 0.81 | 0.80 |
| ADORA3 | 0.80 | 0.77 |
| C3AR1 | 0.80 | 0.73 |
| C1QC | 0.79 | 0.77 |
| PTPRC | 0.78 | 0.75 |
| EVI2B | 0.78 | 0.82 |
| C3 | 0.77 | 0.72 |
| CTSS | 0.77 | 0.78 |
| SLC2A5 | 0.77 | 0.77 |
| Top 10 negatively co-expressed genes | ||
| Gene | Pearson's Correlation | Spearman's Correlation |
| KIAA1949 | -0.49 | -0.43 |
| MYCN | -0.48 | -0.35 |
| ISLR2 | -0.48 | -0.33 |
| SH2B2 | -0.48 | -0.56 |
| TUBB2B | -0.48 | -0.48 |
| AL033532.1 | -0.47 | -0.40 |
| VASH2 | -0.47 | -0.39 |
| SH3BP2 | -0.47 | -0.51 |
| ZBTB12 | -0.46 | -0.38 |
| ZNF551 | -0.46 | -0.38 |
Section V. Pathway annotation
| Pathway name | Pathway size | # SZGR 2.0 genes in pathway | Info |
|---|---|---|---|
| JAATINEN HEMATOPOIETIC STEM CELL DN | 226 | 132 | All SZGR 2.0 genes in this pathway |
| NIKOLSKY BREAST CANCER 16P13 AMPLICON | 120 | 49 | All SZGR 2.0 genes in this pathway |