Gene Page: METTL2A
Summary ?
| GeneID | 339175 |
| Symbol | METTL2A |
| Synonyms | METTL2 |
| Description | methyltransferase like 2A |
| Reference | HGNC:HGNC:25755|Ensembl:ENSG00000087995|HPRD:07795|Vega:OTTHUMG00000164527 |
| Gene type | protein-coding |
| Map location | 17q23.2 |
| Pascal p-value | 0.065 |
| Sherlock p-value | 0.449 |
| Fetal beta | 0.711 |
| DMG | 1 (# studies) |
| eGene | Myers' cis & trans Meta |
| Support | Ascano FMRP targets |
Gene in Data Sources
| Gene set name | Method of gene set | Description | Info |
|---|---|---|---|
| CV:PGCnp | Genome-wide Association Study | GWAS | |
| DMG:Wockner_2014 | Genome-wide DNA methylation analysis | This dataset includes 4641 differentially methylated probes corresponding to 2929 unique genes between schizophrenia patients (n=24) and controls (n=24). | 1 |
Section I. Genetics and epigenetics annotation
 Differentially methylated gene
| Probe | Chromosome | Position | Nearest gene | P (dis) | Beta (dis) | FDR (dis) | Study |
|---|---|---|---|---|---|---|---|
| cg09026875 | 17 | 60501189 | METTL2A | 2.745E-4 | -0.185 | 0.038 | DMG:Wockner_2014 |
eQTL annotation
| SNP ID | Chromosome | Position | eGene | Gene Entrez ID | pvalue | qvalue | TSS distance | eQTL type |
|---|---|---|---|---|---|---|---|---|
| rs3769467 | chr2 | 201205340 | METTL2A | 339175 | 0.01 | trans | ||
| rs3769461 | chr2 | 201222657 | METTL2A | 339175 | 0.01 | trans | ||
| rs763641 | chr11 | 123846625 | METTL2A | 339175 | 0.2 | trans | ||
| rs2408301 | chr13 | 51808915 | METTL2A | 339175 | 0.09 | trans | ||
| rs5998188 | chr22 | 32344841 | METTL2A | 339175 | 0.15 | trans |
Section II. Transcriptome annotation
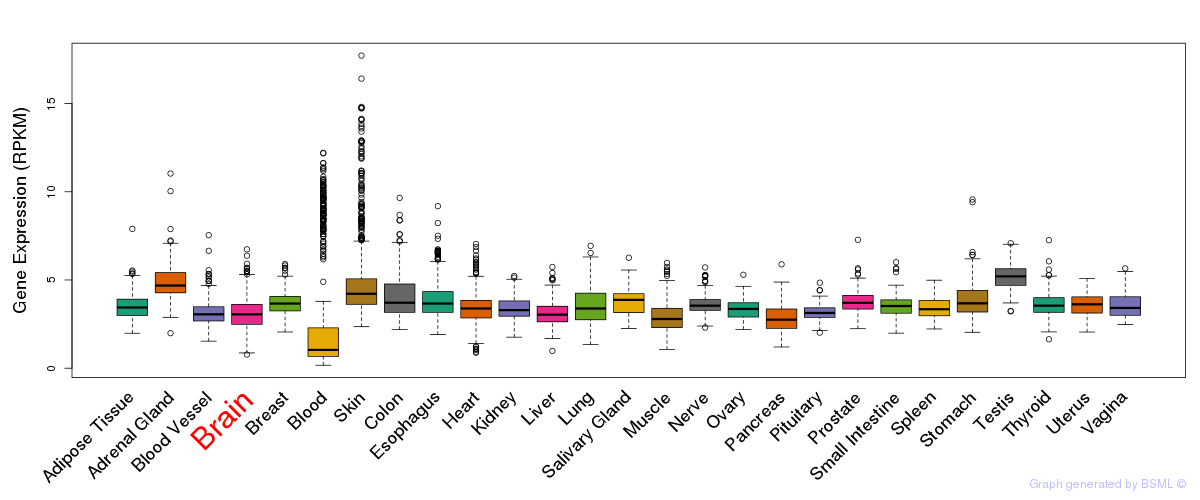
General gene expression (GTEx)
Gene expression during devlopment (BrainCloud)
Footnote:
A total of 269 time points ploted, with n=38 fetal samples (x=1:38). Each triangle represents one time point.
Gene expression of temporal and spatial changes (BrainSpan)
Footnote:
SC: sub-cortical regions; SM: sensory-motor regions; FC: frontal cortex; and TP: temporal-parietal cortex
ST1: fetal (13 - 26 postconception weeks), ST2: early infancy to late childhood (4 months to 11 years), and ST3: adolescence to adulthood (13 - 23 years)
The bar shown representes the lower 25% and upper 25% of the expression distribution.
No co-expressed genes in brain regions
Section V. Pathway annotation
| Pathway name | Pathway size | # SZGR 2.0 genes in pathway | Info |
|---|---|---|---|
| LINDGREN BLADDER CANCER CLUSTER 3 UP | 329 | 196 | All SZGR 2.0 genes in this pathway |
| HEIDENBLAD AMPLIFIED IN PANCREATIC CANCER | 31 | 19 | All SZGR 2.0 genes in this pathway |
| NIKOLSKY BREAST CANCER 17Q21 Q25 AMPLICON | 335 | 181 | All SZGR 2.0 genes in this pathway |
| KYNG WERNER SYNDROM AND NORMAL AGING DN | 225 | 124 | All SZGR 2.0 genes in this pathway |