Gene Page: COL28A1
Summary ?
| GeneID | 340267 |
| Symbol | COL28A1 |
| Synonyms | COL28 |
| Description | collagen type XXVIII alpha 1 |
| Reference | MIM:609996|HGNC:HGNC:22442|Ensembl:ENSG00000215018|Vega:OTTHUMG00000150034 |
| Gene type | protein-coding |
| Map location | 7p21.3 |
| Pascal p-value | 0.491 |
| Fetal beta | -0.094 |
| eGene | Anterior cingulate cortex BA24 Caudate basal ganglia Cerebellar Hemisphere Cerebellum Cortex Frontal Cortex BA9 Hippocampus Hypothalamus Putamen basal ganglia |
Gene in Data Sources
| Gene set name | Method of gene set | Description | Info |
|---|---|---|---|
| CV:GWAScat | Genome-wide Association Studies | This data set includes 560 SNPs associated with schizophrenia. A total of 486 genes were mapped to these SNPs within 50kb. | |
| CV:GWASdb | Genome-wide Association Studies | GWASdb records for schizophrenia | |
| CV:PGCnp | Genome-wide Association Study | GWAS |
Section I. Genetics and epigenetics annotation
 eQTL annotation
| SNP ID | Chromosome | Position | eGene | Gene Entrez ID | pvalue | qvalue | TSS distance | eQTL type |
|---|---|---|---|---|---|---|---|---|
| rs1971649 | 7 | 7618622 | COL28A1 | ENSG00000215018.5 | 1.24142E-6 | 0.04 | -43138 | gtex_brain_ba24 |
| rs11771272 | 7 | 7643041 | COL28A1 | ENSG00000215018.5 | 1.14491E-6 | 0.04 | -67557 | gtex_brain_ba24 |
| rs7459399 | 7 | 7618152 | COL28A1 | ENSG00000215018.5 | 4.61255E-7 | 0.01 | -42668 | gtex_brain_putamen_basal |
| rs1971649 | 7 | 7618622 | COL28A1 | ENSG00000215018.5 | 8.5389E-7 | 0.01 | -43138 | gtex_brain_putamen_basal |
| rs75311406 | 7 | 7620607 | COL28A1 | ENSG00000215018.5 | 5.04091E-7 | 0.01 | -45123 | gtex_brain_putamen_basal |
| rs7803888 | 7 | 7628416 | COL28A1 | ENSG00000215018.5 | 4.60803E-7 | 0.01 | -52932 | gtex_brain_putamen_basal |
| rs7784747 | 7 | 7631718 | COL28A1 | ENSG00000215018.5 | 2.13534E-7 | 0.01 | -56234 | gtex_brain_putamen_basal |
Section II. Transcriptome annotation
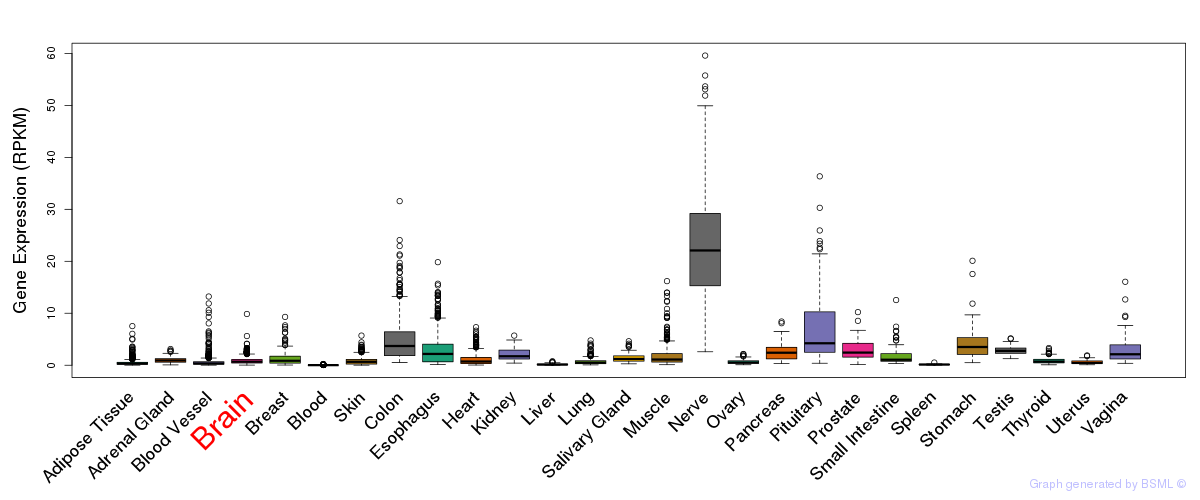
General gene expression (GTEx)
Gene expression during devlopment (BrainCloud)
Footnote:
A total of 269 time points ploted, with n=38 fetal samples (x=1:38). Each triangle represents one time point.
Gene expression of temporal and spatial changes (BrainSpan)
Footnote:
SC: sub-cortical regions; SM: sensory-motor regions; FC: frontal cortex; and TP: temporal-parietal cortex
ST1: fetal (13 - 26 postconception weeks), ST2: early infancy to late childhood (4 months to 11 years), and ST3: adolescence to adulthood (13 - 23 years)
The bar shown representes the lower 25% and upper 25% of the expression distribution.
No co-expressed genes in brain regions
Section V. Pathway annotation
| Pathway name | Pathway size | # SZGR 2.0 genes in pathway | Info |
|---|---|---|---|
| REACTOME EXTRACELLULAR MATRIX ORGANIZATION | 87 | 42 | All SZGR 2.0 genes in this pathway |
| REACTOME COLLAGEN FORMATION | 58 | 31 | All SZGR 2.0 genes in this pathway |
| ZHOU INFLAMMATORY RESPONSE FIMA UP | 544 | 308 | All SZGR 2.0 genes in this pathway |
| DODD NASOPHARYNGEAL CARCINOMA UP | 1821 | 933 | All SZGR 2.0 genes in this pathway |
| CREIGHTON ENDOCRINE THERAPY RESISTANCE 5 | 482 | 296 | All SZGR 2.0 genes in this pathway |
| ZWANG TRANSIENTLY UP BY 2ND EGF PULSE ONLY | 1725 | 838 | All SZGR 2.0 genes in this pathway |
| NABA COLLAGENS | 44 | 26 | All SZGR 2.0 genes in this pathway |
| NABA CORE MATRISOME | 275 | 148 | All SZGR 2.0 genes in this pathway |
| NABA MATRISOME | 1028 | 559 | All SZGR 2.0 genes in this pathway |