Gene Page: CHST6
Summary ?
| GeneID | 4166 |
| Symbol | CHST6 |
| Synonyms | MCDC1 |
| Description | carbohydrate (N-acetylglucosamine 6-O) sulfotransferase 6 |
| Reference | MIM:605294|HGNC:HGNC:6938|Ensembl:ENSG00000183196|HPRD:05597|Vega:OTTHUMG00000137612 |
| Gene type | protein-coding |
| Map location | 16q22 |
| Pascal p-value | 0.19 |
| Sherlock p-value | 0.376 |
| Fetal beta | -1.504 |
| DMG | 1 (# studies) |
| eGene | Myers' cis & trans |
Gene in Data Sources
| Gene set name | Method of gene set | Description | Info |
|---|---|---|---|
| CV:PGCnp | Genome-wide Association Study | GWAS | |
| DMG:Wockner_2014 | Genome-wide DNA methylation analysis | This dataset includes 4641 differentially methylated probes corresponding to 2929 unique genes between schizophrenia patients (n=24) and controls (n=24). | 1 |
Section I. Genetics and epigenetics annotation
 Differentially methylated gene
| Probe | Chromosome | Position | Nearest gene | P (dis) | Beta (dis) | FDR (dis) | Study |
|---|---|---|---|---|---|---|---|
| cg08033548 | 16 | 75529105 | CHST6 | 5.16E-5 | -0.357 | 0.022 | DMG:Wockner_2014 |
eQTL annotation
| SNP ID | Chromosome | Position | eGene | Gene Entrez ID | pvalue | qvalue | TSS distance | eQTL type |
|---|---|---|---|---|---|---|---|---|
| rs7268640 | chr20 | 47150267 | CHST6 | 4166 | 0.13 | trans |
Section II. Transcriptome annotation
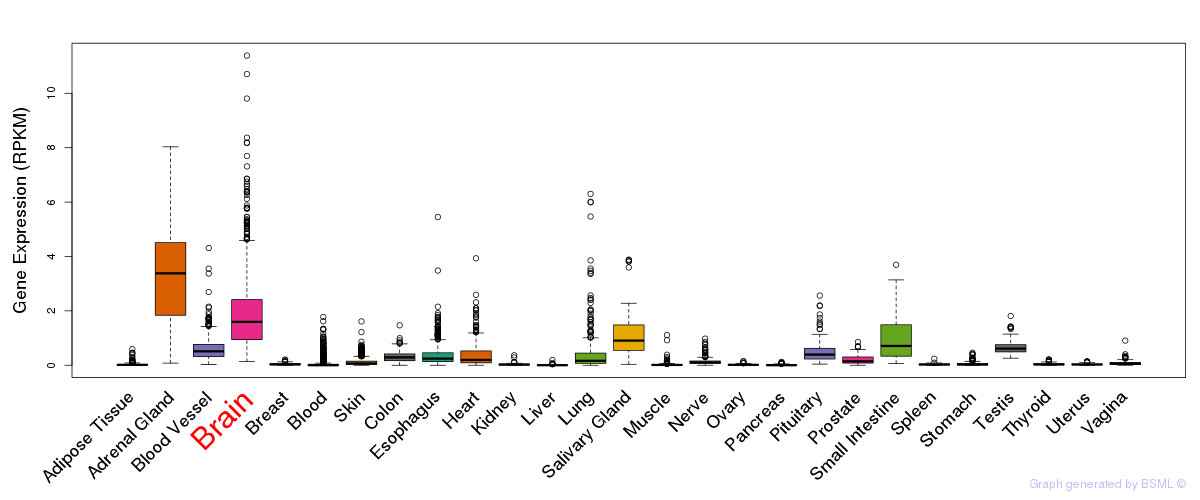
General gene expression (GTEx)
Gene expression during devlopment (BrainCloud)
Footnote:
A total of 269 time points ploted, with n=38 fetal samples (x=1:38). Each triangle represents one time point.
Gene expression of temporal and spatial changes (BrainSpan)
Footnote:
SC: sub-cortical regions; SM: sensory-motor regions; FC: frontal cortex; and TP: temporal-parietal cortex
ST1: fetal (13 - 26 postconception weeks), ST2: early infancy to late childhood (4 months to 11 years), and ST3: adolescence to adulthood (13 - 23 years)
The bar shown representes the lower 25% and upper 25% of the expression distribution.
Top co-expressed genes in brain regions
| Top 10 positively co-expressed genes | ||
| Gene | Pearson's Correlation | Spearman's Correlation |
| PSMF1 | 0.91 | 0.87 |
| FARSA | 0.91 | 0.88 |
| PPP2R1A | 0.91 | 0.88 |
| RRAGA | 0.90 | 0.86 |
| ALAS1 | 0.90 | 0.87 |
| MRPL37 | 0.90 | 0.86 |
| TRAP1 | 0.90 | 0.85 |
| TBRG4 | 0.89 | 0.87 |
| ADCK2 | 0.88 | 0.85 |
| PSMC4 | 0.88 | 0.83 |
| Top 10 negatively co-expressed genes | ||
| Gene | Pearson's Correlation | Spearman's Correlation |
| AF347015.26 | -0.75 | -0.70 |
| MT-CO2 | -0.75 | -0.66 |
| AF347015.8 | -0.75 | -0.68 |
| AF347015.2 | -0.74 | -0.67 |
| AF347015.33 | -0.74 | -0.68 |
| MT-CYB | -0.72 | -0.65 |
| AF347015.21 | -0.71 | -0.66 |
| AF347015.18 | -0.70 | -0.75 |
| AF347015.31 | -0.70 | -0.63 |
| AF347015.15 | -0.70 | -0.65 |
Section V. Pathway annotation
| Pathway name | Pathway size | # SZGR 2.0 genes in pathway | Info |
|---|---|---|---|
| KEGG GLYCOSAMINOGLYCAN BIOSYNTHESIS KERATAN SULFATE | 15 | 11 | All SZGR 2.0 genes in this pathway |
| REACTOME KERATAN SULFATE BIOSYNTHESIS | 26 | 18 | All SZGR 2.0 genes in this pathway |
| REACTOME KERATAN SULFATE KERATIN METABOLISM | 30 | 21 | All SZGR 2.0 genes in this pathway |
| REACTOME GLYCOSAMINOGLYCAN METABOLISM | 111 | 69 | All SZGR 2.0 genes in this pathway |
| REACTOME METABOLISM OF CARBOHYDRATES | 247 | 154 | All SZGR 2.0 genes in this pathway |
| SENGUPTA NASOPHARYNGEAL CARCINOMA DN | 349 | 157 | All SZGR 2.0 genes in this pathway |
| DODD NASOPHARYNGEAL CARCINOMA UP | 1821 | 933 | All SZGR 2.0 genes in this pathway |
| MCCABE BOUND BY HOXC6 | 469 | 239 | All SZGR 2.0 genes in this pathway |
| LABBE TARGETS OF TGFB1 AND WNT3A UP | 111 | 70 | All SZGR 2.0 genes in this pathway |
| JIANG TIP30 TARGETS UP | 46 | 28 | All SZGR 2.0 genes in this pathway |
| NOUSHMEHR GBM SILENCED BY METHYLATION | 50 | 32 | All SZGR 2.0 genes in this pathway |
| ZWANG TRANSIENTLY UP BY 2ND EGF PULSE ONLY | 1725 | 838 | All SZGR 2.0 genes in this pathway |