Gene Page: C9orf114
Summary ?
| GeneID | 51490 |
| Symbol | C9orf114 |
| Synonyms | CENP-32|HSPC109 |
| Description | chromosome 9 open reading frame 114 |
| Reference | HGNC:HGNC:26933|Ensembl:ENSG00000198917|HPRD:12935|Vega:OTTHUMG00000020762 |
| Gene type | protein-coding |
| Map location | 9q34.11 |
| Pascal p-value | 5.123E-5 |
| Fetal beta | -0.482 |
| DMG | 1 (# studies) |
| Support | CompositeSet |
Gene in Data Sources
| Gene set name | Method of gene set | Description | Info |
|---|---|---|---|
| CV:PGCnp | Genome-wide Association Study | GWAS | |
| DMG:Wockner_2014 | Genome-wide DNA methylation analysis | This dataset includes 4641 differentially methylated probes corresponding to 2929 unique genes between schizophrenia patients (n=24) and controls (n=24). | 1 |
| DNM:Fromer_2014 | Whole Exome Sequencing analysis | This study reported a WES study of 623 schizophrenia trios, reporting DNMs using genomic DNA. |
Section I. Genetics and epigenetics annotation
 DNM table
| Gene | Chromosome | Position | Ref | Alt | Transcript | AA change | Mutation type | Sift | CG46 | Trait | Study |
|---|---|---|---|---|---|---|---|---|---|---|---|
| C9orf114 | chr9 | 131591112 | T | G | NM_016390 | p.37D>A | missense | Schizophrenia | DNM:Fromer_2014 |
Differentially methylated gene
| Probe | Chromosome | Position | Nearest gene | P (dis) | Beta (dis) | FDR (dis) | Study |
|---|---|---|---|---|---|---|---|
| cg00475955 | 9 | 131592049 | C9orf114 | 2.253E-4 | -0.332 | 0.036 | DMG:Wockner_2014 |
Section II. Transcriptome annotation
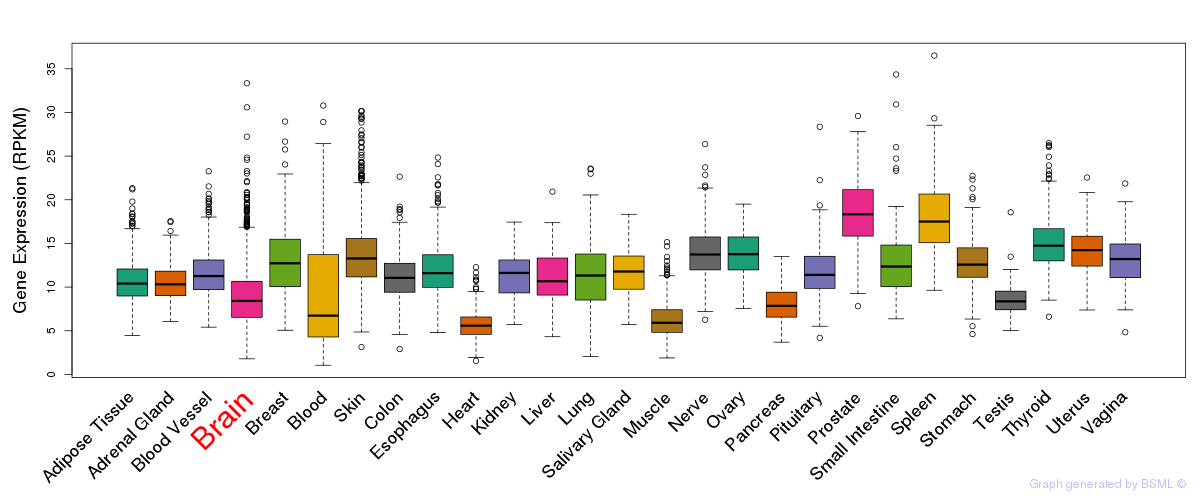
General gene expression (GTEx)
Gene expression during devlopment (BrainCloud)
Footnote:
A total of 269 time points ploted, with n=38 fetal samples (x=1:38). Each triangle represents one time point.
Gene expression of temporal and spatial changes (BrainSpan)
Footnote:
SC: sub-cortical regions; SM: sensory-motor regions; FC: frontal cortex; and TP: temporal-parietal cortex
ST1: fetal (13 - 26 postconception weeks), ST2: early infancy to late childhood (4 months to 11 years), and ST3: adolescence to adulthood (13 - 23 years)
The bar shown representes the lower 25% and upper 25% of the expression distribution.
No co-expressed genes in brain regions
Section V. Pathway annotation
| Pathway name | Pathway size | # SZGR 2.0 genes in pathway | Info |
|---|---|---|---|
| LINDGREN BLADDER CANCER WITH LOH IN CHR9Q | 116 | 71 | All SZGR 2.0 genes in this pathway |
| AMIT EGF RESPONSE 480 HELA | 164 | 118 | All SZGR 2.0 genes in this pathway |
| BYSTRYKH HEMATOPOIESIS STEM CELL AND BRAIN QTL TRANS | 185 | 114 | All SZGR 2.0 genes in this pathway |
| BYSTRYKH HEMATOPOIESIS STEM CELL QTL TRANS | 882 | 572 | All SZGR 2.0 genes in this pathway |
| WANG TUMOR INVASIVENESS UP | 374 | 247 | All SZGR 2.0 genes in this pathway |
| CHEN METABOLIC SYNDROM NETWORK | 1210 | 725 | All SZGR 2.0 genes in this pathway |
| CROONQUIST IL6 DEPRIVATION DN | 98 | 69 | All SZGR 2.0 genes in this pathway |