Gene Page: EXOC6
Summary ?
| GeneID | 54536 |
| Symbol | EXOC6 |
| Synonyms | EXOC6A|SEC15|SEC15L|SEC15L1|SEC15L3|Sec15p |
| Description | exocyst complex component 6 |
| Reference | MIM:609672|HGNC:HGNC:23196|Ensembl:ENSG00000138190|HPRD:10216|Vega:OTTHUMG00000018767 |
| Gene type | protein-coding |
| Map location | 10q23.33 |
| Pascal p-value | 0.214 |
| Sherlock p-value | 0.34 |
| Fetal beta | 0.262 |
| DMG | 3 (# studies) |
| Support | EXOCYTOSIS |
Gene in Data Sources
| Gene set name | Method of gene set | Description | Info |
|---|---|---|---|
| CV:PGCnp | Genome-wide Association Study | GWAS | |
| DMG:Jaffe_2016 | Genome-wide DNA methylation analysis | This dataset includes 2,104 probes/CpGs associated with SZ patients (n=108) compared to 136 controls at Bonferroni-adjusted P < 0.05. | 4 |
| DMG:vanEijk_2014 | Genome-wide DNA methylation analysis | This dataset includes 432 differentially methylated CpG sites corresponding to 391 unique transcripts between schizophrenia patients (n=260) and unaffected controls (n=250). | 4 |
| DMG:Wockner_2014 | Genome-wide DNA methylation analysis | This dataset includes 4641 differentially methylated probes corresponding to 2929 unique genes between schizophrenia patients (n=24) and controls (n=24). | 4 |
Section I. Genetics and epigenetics annotation
 Differentially methylated gene
| Probe | Chromosome | Position | Nearest gene | P (dis) | Beta (dis) | FDR (dis) | Study |
|---|---|---|---|---|---|---|---|
| cg01038940 | 10 | 94652135 | EXOC6 | 2.49E-5 | 0.449 | 0.017 | DMG:Wockner_2014 |
| cg07236146 | 10 | 94607939 | EXOC6 | 1.52E-8 | -0.014 | 5.75E-6 | DMG:Jaffe_2016 |
| cg00238318 | 10 | 94607950 | EXOC6 | 2.86E-8 | -0.009 | 8.87E-6 | DMG:Jaffe_2016 |
| cg19780563 | 10 | 94594494 | EXOC6 | 0.001 | 5.901 | DMG:vanEijk_2014 |
Section II. Transcriptome annotation
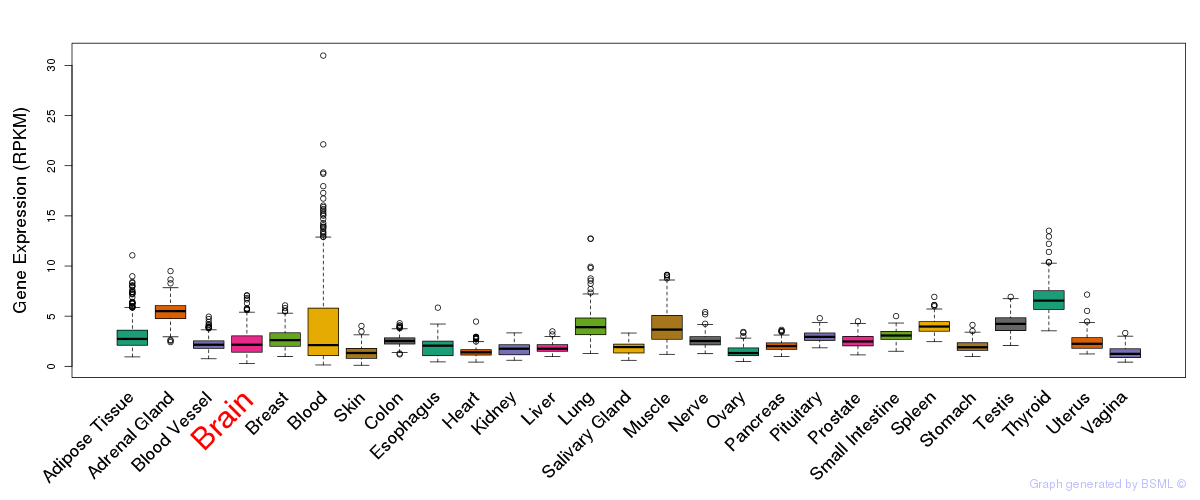
General gene expression (GTEx)
Gene expression during devlopment (BrainCloud)
Footnote:
A total of 269 time points ploted, with n=38 fetal samples (x=1:38). Each triangle represents one time point.
Gene expression of temporal and spatial changes (BrainSpan)
Footnote:
SC: sub-cortical regions; SM: sensory-motor regions; FC: frontal cortex; and TP: temporal-parietal cortex
ST1: fetal (13 - 26 postconception weeks), ST2: early infancy to late childhood (4 months to 11 years), and ST3: adolescence to adulthood (13 - 23 years)
The bar shown representes the lower 25% and upper 25% of the expression distribution.
No co-expressed genes in brain regions
Section V. Pathway annotation
| Pathway name | Pathway size | # SZGR 2.0 genes in pathway | Info |
|---|---|---|---|
| PID INSULIN PATHWAY | 45 | 32 | All SZGR 2.0 genes in this pathway |
| PID ARF6 TRAFFICKING PATHWAY | 49 | 34 | All SZGR 2.0 genes in this pathway |
| REACTOME DIABETES PATHWAYS | 133 | 91 | All SZGR 2.0 genes in this pathway |
| REACTOME INSULIN SYNTHESIS AND PROCESSING | 21 | 15 | All SZGR 2.0 genes in this pathway |
| HOOI ST7 TARGETS DN | 123 | 78 | All SZGR 2.0 genes in this pathway |
| WANG LMO4 TARGETS DN | 352 | 225 | All SZGR 2.0 genes in this pathway |
| GRAESSMANN APOPTOSIS BY DOXORUBICIN DN | 1781 | 1082 | All SZGR 2.0 genes in this pathway |
| GRAESSMANN RESPONSE TO MC AND DOXORUBICIN DN | 770 | 415 | All SZGR 2.0 genes in this pathway |
| LASTOWSKA NEUROBLASTOMA COPY NUMBER DN | 800 | 473 | All SZGR 2.0 genes in this pathway |
| HATADA METHYLATED IN LUNG CANCER UP | 390 | 236 | All SZGR 2.0 genes in this pathway |
| IVANOVA HEMATOPOIESIS LATE PROGENITOR | 544 | 307 | All SZGR 2.0 genes in this pathway |
| WENDT COHESIN TARGETS UP | 33 | 19 | All SZGR 2.0 genes in this pathway |
| PILON KLF1 TARGETS UP | 504 | 321 | All SZGR 2.0 genes in this pathway |
| WAKABAYASHI ADIPOGENESIS PPARG BOUND 36HR | 29 | 23 | All SZGR 2.0 genes in this pathway |
| WAKABAYASHI ADIPOGENESIS PPARG RXRA BOUND 8D | 882 | 506 | All SZGR 2.0 genes in this pathway |
| DURAND STROMA NS UP | 162 | 103 | All SZGR 2.0 genes in this pathway |