Gene Page: BEST2
Summary ?
| GeneID | 54831 |
| Symbol | BEST2 |
| Synonyms | VMD2L1 |
| Description | bestrophin 2 |
| Reference | MIM:607335|HGNC:HGNC:17107|Ensembl:ENSG00000039987|Vega:OTTHUMG00000169293 |
| Gene type | protein-coding |
| Map location | 19p13.2 |
| Pascal p-value | 1.235E-4 |
| Fetal beta | -0.849 |
| DMG | 1 (# studies) |
Gene in Data Sources
| Gene set name | Method of gene set | Description | Info |
|---|---|---|---|
| CV:PGCnp | Genome-wide Association Study | GWAS | |
| DMG:Wockner_2014 | Genome-wide DNA methylation analysis | This dataset includes 4641 differentially methylated probes corresponding to 2929 unique genes between schizophrenia patients (n=24) and controls (n=24). | 1 |
Section I. Genetics and epigenetics annotation
 Differentially methylated gene
| Probe | Chromosome | Position | Nearest gene | P (dis) | Beta (dis) | FDR (dis) | Study |
|---|---|---|---|---|---|---|---|
| cg19743791 | 19 | 12863557 | BEST2 | 5.061E-4 | 0.395 | 0.047 | DMG:Wockner_2014 |
Section II. Transcriptome annotation
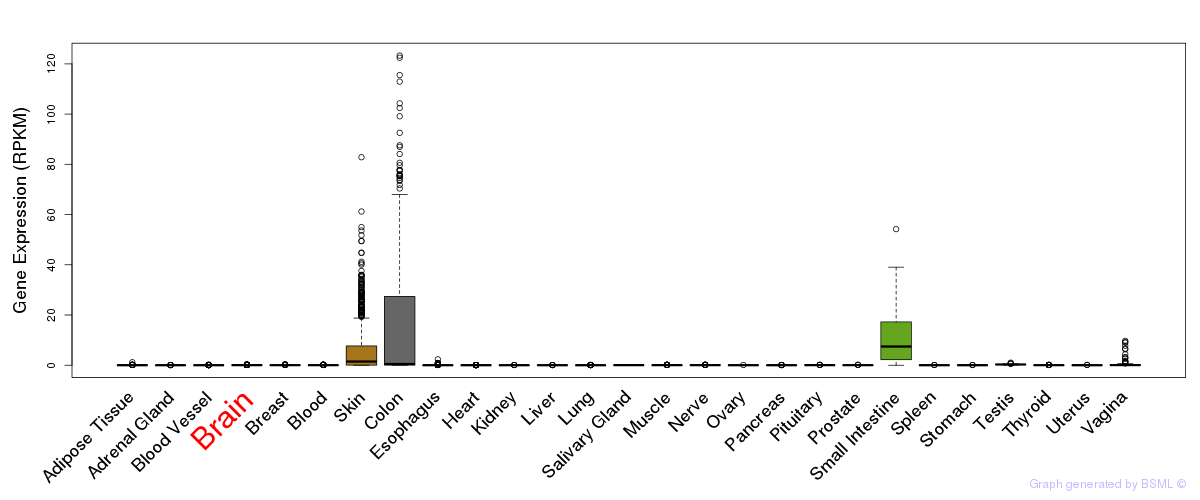
General gene expression (GTEx)
Gene expression during devlopment (BrainCloud)
Footnote:
A total of 269 time points ploted, with n=38 fetal samples (x=1:38). Each triangle represents one time point.
Gene expression of temporal and spatial changes (BrainSpan)
Footnote:
SC: sub-cortical regions; SM: sensory-motor regions; FC: frontal cortex; and TP: temporal-parietal cortex
ST1: fetal (13 - 26 postconception weeks), ST2: early infancy to late childhood (4 months to 11 years), and ST3: adolescence to adulthood (13 - 23 years)
The bar shown representes the lower 25% and upper 25% of the expression distribution.
Top co-expressed genes in brain regions
| Top 10 positively co-expressed genes | ||
| Gene | Pearson's Correlation | Spearman's Correlation |
| ATP6AP1 | 0.90 | 0.88 |
| USP11 | 0.87 | 0.83 |
| RNF123 | 0.86 | 0.83 |
| ACP2 | 0.86 | 0.85 |
| TM9SF4 | 0.86 | 0.82 |
| C17orf28 | 0.85 | 0.84 |
| AP2A2 | 0.85 | 0.83 |
| AP3B2 | 0.85 | 0.81 |
| NPLOC4 | 0.85 | 0.81 |
| NISCH | 0.85 | 0.85 |
| Top 10 negatively co-expressed genes | ||
| Gene | Pearson's Correlation | Spearman's Correlation |
| AF347015.21 | -0.68 | -0.55 |
| MT-CO2 | -0.66 | -0.51 |
| AF347015.31 | -0.65 | -0.51 |
| GNG11 | -0.64 | -0.61 |
| HIGD1B | -0.63 | -0.50 |
| AC098691.2 | -0.63 | -0.57 |
| AF347015.2 | -0.63 | -0.44 |
| AF347015.18 | -0.62 | -0.52 |
| MT-CYB | -0.62 | -0.47 |
| AF347015.8 | -0.62 | -0.49 |
Section V. Pathway annotation
| Pathway name | Pathway size | # SZGR 2.0 genes in pathway | Info |
|---|---|---|---|
| CHEBOTAEV GR TARGETS UP | 77 | 62 | All SZGR 2.0 genes in this pathway |
| HATADA METHYLATED IN LUNG CANCER DN | 38 | 13 | All SZGR 2.0 genes in this pathway |
| MIKKELSEN MEF ICP WITH H3K27ME3 | 206 | 108 | All SZGR 2.0 genes in this pathway |
| MIKKELSEN IPS ICP WITH H3K4ME3 AND H327ME3 | 126 | 83 | All SZGR 2.0 genes in this pathway |
| MIKKELSEN ES ICP WITH H3K4ME3 AND H3K27ME3 | 137 | 85 | All SZGR 2.0 genes in this pathway |
| PURBEY TARGETS OF CTBP1 NOT SATB1 DN | 448 | 282 | All SZGR 2.0 genes in this pathway |
| ZWANG CLASS 1 TRANSIENTLY INDUCED BY EGF | 516 | 308 | All SZGR 2.0 genes in this pathway |