Gene Page: TMEM214
Summary ?
| GeneID | 54867 |
| Symbol | TMEM214 |
| Synonyms | - |
| Description | transmembrane protein 214 |
| Reference | MIM:615301|HGNC:HGNC:25983|Ensembl:ENSG00000119777|HPRD:07887|Vega:OTTHUMG00000151999 |
| Gene type | protein-coding |
| Map location | 2p23.3 |
| Pascal p-value | 5.45E-4 |
| Sherlock p-value | 0.271 |
| Fetal beta | -0.273 |
| DMG | 1 (# studies) |
Gene in Data Sources
| Gene set name | Method of gene set | Description | Info |
|---|---|---|---|
| CV:PGCnp | Genome-wide Association Study | GWAS | |
| DMG:Wockner_2014 | Genome-wide DNA methylation analysis | This dataset includes 4641 differentially methylated probes corresponding to 2929 unique genes between schizophrenia patients (n=24) and controls (n=24). | 1 |
Section I. Genetics and epigenetics annotation
 Differentially methylated gene
| Probe | Chromosome | Position | Nearest gene | P (dis) | Beta (dis) | FDR (dis) | Study |
|---|---|---|---|---|---|---|---|
| cg01026613 | 2 | 27255450 | TMEM214 | 2.514E-4 | -0.2 | 0.037 | DMG:Wockner_2014 |
Section II. Transcriptome annotation
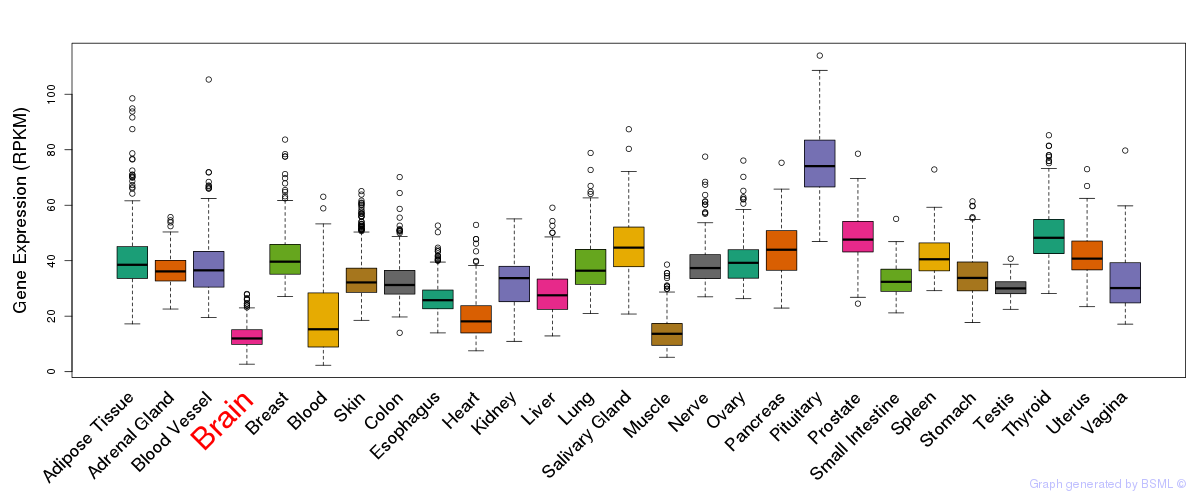
General gene expression (GTEx)
Gene expression during devlopment (BrainCloud)
Footnote:
A total of 269 time points ploted, with n=38 fetal samples (x=1:38). Each triangle represents one time point.
Gene expression of temporal and spatial changes (BrainSpan)
Footnote:
SC: sub-cortical regions; SM: sensory-motor regions; FC: frontal cortex; and TP: temporal-parietal cortex
ST1: fetal (13 - 26 postconception weeks), ST2: early infancy to late childhood (4 months to 11 years), and ST3: adolescence to adulthood (13 - 23 years)
The bar shown representes the lower 25% and upper 25% of the expression distribution.
Top co-expressed genes in brain regions
| Top 10 positively co-expressed genes | ||
| Gene | Pearson's Correlation | Spearman's Correlation |
| HLTF | 0.93 | 0.94 |
| MORC3 | 0.93 | 0.94 |
| ZNF248 | 0.93 | 0.95 |
| TTC37 | 0.93 | 0.93 |
| IBTK | 0.92 | 0.93 |
| BRWD1 | 0.92 | 0.92 |
| ZNF791 | 0.92 | 0.94 |
| C12orf30 | 0.91 | 0.93 |
| USP48 | 0.91 | 0.91 |
| C3orf63 | 0.90 | 0.91 |
| Top 10 negatively co-expressed genes | ||
| Gene | Pearson's Correlation | Spearman's Correlation |
| AF347015.31 | -0.75 | -0.78 |
| MT-CO2 | -0.75 | -0.78 |
| AF347015.21 | -0.73 | -0.79 |
| HIGD1B | -0.72 | -0.79 |
| IFI27 | -0.72 | -0.77 |
| AF347015.8 | -0.72 | -0.76 |
| MT-CYB | -0.71 | -0.74 |
| AF347015.27 | -0.70 | -0.73 |
| FXYD1 | -0.70 | -0.75 |
| CST3 | -0.69 | -0.77 |
Section V. Pathway annotation
| Pathway name | Pathway size | # SZGR 2.0 genes in pathway | Info |
|---|---|---|---|
| ONKEN UVEAL MELANOMA UP | 783 | 507 | All SZGR 2.0 genes in this pathway |
| ONDER CDH1 TARGETS 1 UP | 140 | 85 | All SZGR 2.0 genes in this pathway |
| BILD E2F3 ONCOGENIC SIGNATURE | 246 | 153 | All SZGR 2.0 genes in this pathway |
| YOSHIMURA MAPK8 TARGETS DN | 366 | 257 | All SZGR 2.0 genes in this pathway |
| FEVR CTNNB1 TARGETS UP | 682 | 433 | All SZGR 2.0 genes in this pathway |