Gene Page: PIH1D1
Summary ?
| GeneID | 55011 |
| Symbol | PIH1D1 |
| Synonyms | NOP17 |
| Description | PIH1 domain containing 1 |
| Reference | MIM:611480|HGNC:HGNC:26075|Ensembl:ENSG00000104872|HPRD:07938|Vega:OTTHUMG00000183167 |
| Gene type | protein-coding |
| Map location | 19q13.33 |
| Pascal p-value | 0.002 |
| Sherlock p-value | 0.033 |
| Fetal beta | -0.334 |
| DMG | 2 (# studies) |
Gene in Data Sources
| Gene set name | Method of gene set | Description | Info |
|---|---|---|---|
| CV:PGCnp | Genome-wide Association Study | GWAS | |
| DMG:Jaffe_2016 | Genome-wide DNA methylation analysis | This dataset includes 2,104 probes/CpGs associated with SZ patients (n=108) compared to 136 controls at Bonferroni-adjusted P < 0.05. | 2 |
| DMG:vanEijk_2014 | Genome-wide DNA methylation analysis | This dataset includes 432 differentially methylated CpG sites corresponding to 391 unique transcripts between schizophrenia patients (n=260) and unaffected controls (n=250). | 2 |
Section I. Genetics and epigenetics annotation
 Differentially methylated gene
| Probe | Chromosome | Position | Nearest gene | P (dis) | Beta (dis) | FDR (dis) | Study |
|---|---|---|---|---|---|---|---|
| cg25658980 | 19 | 49955004 | PIH1D1 | 1.06E-9 | -0.009 | 1.21E-6 | DMG:Jaffe_2016 |
| cg07127225 | 19 | 50016538 | PIH1D1 | 3.986E-4 | 3.753 | DMG:vanEijk_2014 |
Section II. Transcriptome annotation
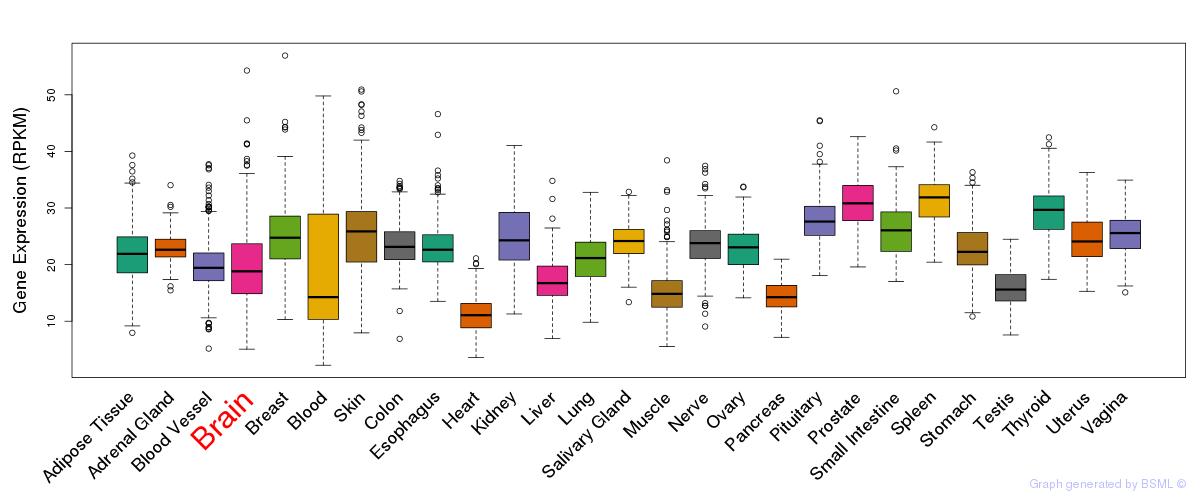
General gene expression (GTEx)
Gene expression during devlopment (BrainCloud)
Footnote:
A total of 269 time points ploted, with n=38 fetal samples (x=1:38). Each triangle represents one time point.
Gene expression of temporal and spatial changes (BrainSpan)
Footnote:
SC: sub-cortical regions; SM: sensory-motor regions; FC: frontal cortex; and TP: temporal-parietal cortex
ST1: fetal (13 - 26 postconception weeks), ST2: early infancy to late childhood (4 months to 11 years), and ST3: adolescence to adulthood (13 - 23 years)
The bar shown representes the lower 25% and upper 25% of the expression distribution.
Top co-expressed genes in brain regions
| Top 10 positively co-expressed genes | ||
| Gene | Pearson's Correlation | Spearman's Correlation |
| STIL | 0.89 | 0.90 |
| RACGAP1P | 0.87 | 0.86 |
| NCAPG2 | 0.86 | 0.90 |
| MCM4 | 0.86 | 0.89 |
| C21orf45 | 0.86 | 0.85 |
| TDP1 | 0.85 | 0.90 |
| PLK4 | 0.85 | 0.89 |
| POLA1 | 0.85 | 0.82 |
| WDHD1 | 0.84 | 0.86 |
| PRKD3 | 0.84 | 0.72 |
| Top 10 negatively co-expressed genes | ||
| Gene | Pearson's Correlation | Spearman's Correlation |
| MT-CO2 | -0.61 | -0.81 |
| AF347015.31 | -0.61 | -0.79 |
| AF347015.27 | -0.61 | -0.79 |
| AF347015.33 | -0.60 | -0.78 |
| FXYD1 | -0.59 | -0.78 |
| AF347015.8 | -0.58 | -0.80 |
| MT-CYB | -0.58 | -0.77 |
| HLA-F | -0.58 | -0.68 |
| S100B | -0.57 | -0.73 |
| AIFM3 | -0.57 | -0.68 |
Section V. Pathway annotation
| Pathway name | Pathway size | # SZGR 2.0 genes in pathway | Info |
|---|---|---|---|
| TERAMOTO OPN TARGETS CLUSTER 6 | 27 | 17 | All SZGR 2.0 genes in this pathway |
| NUYTTEN EZH2 TARGETS DN | 1024 | 594 | All SZGR 2.0 genes in this pathway |
| BENPORATH NANOG TARGETS | 988 | 594 | All SZGR 2.0 genes in this pathway |
| BENPORATH SOX2 TARGETS | 734 | 436 | All SZGR 2.0 genes in this pathway |
| CUI TCF21 TARGETS 2 UP | 428 | 266 | All SZGR 2.0 genes in this pathway |
| HOFFMANN LARGE TO SMALL PRE BII LYMPHOCYTE UP | 163 | 102 | All SZGR 2.0 genes in this pathway |
| WANG RESPONSE TO GSK3 INHIBITOR SB216763 DN | 374 | 217 | All SZGR 2.0 genes in this pathway |
| LU EZH2 TARGETS UP | 295 | 155 | All SZGR 2.0 genes in this pathway |
| JOHNSTONE PARVB TARGETS 3 DN | 918 | 550 | All SZGR 2.0 genes in this pathway |
| GOBERT OLIGODENDROCYTE DIFFERENTIATION DN | 1080 | 713 | All SZGR 2.0 genes in this pathway |
| KRIEG HYPOXIA NOT VIA KDM3A | 770 | 480 | All SZGR 2.0 genes in this pathway |