Gene Page: STRADB
Summary ?
| GeneID | 55437 |
| Symbol | STRADB |
| Synonyms | ALS2CR2|CALS-21|ILPIP|ILPIPA|PAPK|PRO1038 |
| Description | STE20-related kinase adaptor beta |
| Reference | MIM:607333|HGNC:HGNC:13205|Ensembl:ENSG00000082146|HPRD:09546|Vega:OTTHUMG00000132831 |
| Gene type | protein-coding |
| Map location | 2q33.1 |
| Pascal p-value | 0.686 |
| Sherlock p-value | 4.203E-5 |
| Fetal beta | 0.642 |
| eGene | Cerebellar Hemisphere |
Gene in Data Sources
| Gene set name | Method of gene set | Description | Info |
|---|---|---|---|
| CV:PGCnp | Genome-wide Association Study | GWAS |
Section I. Genetics and epigenetics annotation
Section II. Transcriptome annotation
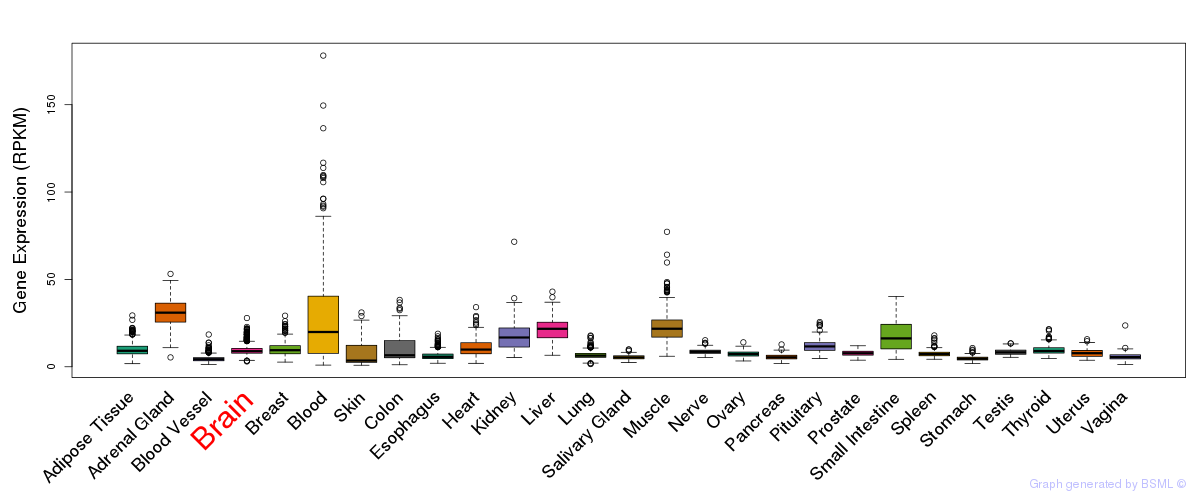
General gene expression (GTEx)
Gene expression during devlopment (BrainCloud)
Footnote:
A total of 269 time points ploted, with n=38 fetal samples (x=1:38). Each triangle represents one time point.
Gene expression of temporal and spatial changes (BrainSpan)
Footnote:
SC: sub-cortical regions; SM: sensory-motor regions; FC: frontal cortex; and TP: temporal-parietal cortex
ST1: fetal (13 - 26 postconception weeks), ST2: early infancy to late childhood (4 months to 11 years), and ST3: adolescence to adulthood (13 - 23 years)
The bar shown representes the lower 25% and upper 25% of the expression distribution.
Top co-expressed genes in brain regions
| Top 10 positively co-expressed genes | ||
| Gene | Pearson's Correlation | Spearman's Correlation |
| CUL2 | 0.90 | 0.88 |
| UBA5 | 0.89 | 0.88 |
| AGGF1 | 0.89 | 0.89 |
| UBE2V2 | 0.89 | 0.87 |
| SRP54 | 0.89 | 0.87 |
| KIAA1012 | 0.88 | 0.87 |
| USP33 | 0.88 | 0.88 |
| TRNT1 | 0.88 | 0.86 |
| GOLGA5 | 0.88 | 0.86 |
| TTRAP | 0.88 | 0.85 |
| Top 10 negatively co-expressed genes | ||
| Gene | Pearson's Correlation | Spearman's Correlation |
| MT-CO2 | -0.71 | -0.64 |
| HIGD1B | -0.69 | -0.65 |
| AF347015.31 | -0.69 | -0.65 |
| AF347015.21 | -0.69 | -0.58 |
| IFI27 | -0.68 | -0.65 |
| AF347015.2 | -0.67 | -0.62 |
| MT-CYB | -0.67 | -0.61 |
| AF347015.8 | -0.66 | -0.61 |
| FXYD1 | -0.66 | -0.63 |
| AF347015.33 | -0.65 | -0.59 |
Section V. Pathway annotation
| Pathway name | Pathway size | # SZGR 2.0 genes in pathway | Info |
|---|---|---|---|
| PID LKB1 PATHWAY | 47 | 37 | All SZGR 2.0 genes in this pathway |
| REACTOME ACTIVATED AMPK STIMULATES FATTY ACID OXIDATION IN MUSCLE | 19 | 16 | All SZGR 2.0 genes in this pathway |
| REACTOME INSULIN RECEPTOR SIGNALLING CASCADE | 87 | 64 | All SZGR 2.0 genes in this pathway |
| REACTOME REGULATION OF AMPK ACTIVITY VIA LKB1 | 15 | 13 | All SZGR 2.0 genes in this pathway |
| REACTOME ENERGY DEPENDENT REGULATION OF MTOR BY LKB1 AMPK | 18 | 15 | All SZGR 2.0 genes in this pathway |
| REACTOME PKB MEDIATED EVENTS | 29 | 23 | All SZGR 2.0 genes in this pathway |
| REACTOME SIGNALING BY INSULIN RECEPTOR | 108 | 72 | All SZGR 2.0 genes in this pathway |
| REACTOME PI3K CASCADE | 71 | 51 | All SZGR 2.0 genes in this pathway |
| CHARAFE BREAST CANCER LUMINAL VS MESENCHYMAL DN | 460 | 312 | All SZGR 2.0 genes in this pathway |
| CHARAFE BREAST CANCER BASAL VS MESENCHYMAL DN | 50 | 36 | All SZGR 2.0 genes in this pathway |
| IVANOVA HEMATOPOIESIS MATURE CELL | 293 | 160 | All SZGR 2.0 genes in this pathway |
| ROME INSULIN TARGETS IN MUSCLE UP | 442 | 263 | All SZGR 2.0 genes in this pathway |