Gene Page: BCAS4
Summary ?
| GeneID | 55653 |
| Symbol | BCAS4 |
| Synonyms | CNOL |
| Description | breast carcinoma amplified sequence 4 |
| Reference | MIM:607471|HGNC:HGNC:14367|Ensembl:ENSG00000124243|HPRD:06314|Vega:OTTHUMG00000032735 |
| Gene type | protein-coding |
| Map location | 20q13.13 |
| Pascal p-value | 0.264 |
| Fetal beta | -0.37 |
| DMG | 1 (# studies) |
| eGene | Cortex Putamen basal ganglia |
Gene in Data Sources
| Gene set name | Method of gene set | Description | Info |
|---|---|---|---|
| CV:PGCnp | Genome-wide Association Study | GWAS | |
| DMG:Wockner_2014 | Genome-wide DNA methylation analysis | This dataset includes 4641 differentially methylated probes corresponding to 2929 unique genes between schizophrenia patients (n=24) and controls (n=24). | 1 |
Section I. Genetics and epigenetics annotation
 Differentially methylated gene
| Probe | Chromosome | Position | Nearest gene | P (dis) | Beta (dis) | FDR (dis) | Study |
|---|---|---|---|---|---|---|---|
| cg02990474 | 20 | 49416093 | BCAS4 | 5.797E-4 | -0.455 | 0.049 | DMG:Wockner_2014 |
eQTL annotation
| SNP ID | Chromosome | Position | eGene | Gene Entrez ID | pvalue | qvalue | TSS distance | eQTL type |
|---|---|---|---|---|---|---|---|---|
| rs12480447 | 20 | 49496178 | BCAS4 | ENSG00000124243.13 | 2.75009E-6 | 0.04 | 84747 | gtex_brain_putamen_basal |
Section II. Transcriptome annotation
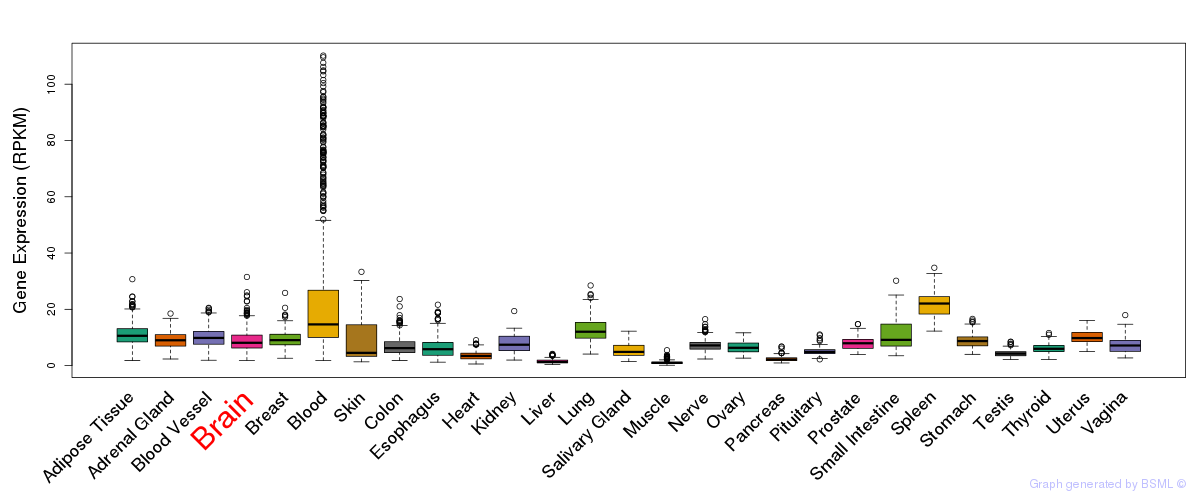
General gene expression (GTEx)
Gene expression during devlopment (BrainCloud)
Footnote:
A total of 269 time points ploted, with n=38 fetal samples (x=1:38). Each triangle represents one time point.
Gene expression of temporal and spatial changes (BrainSpan)
Footnote:
SC: sub-cortical regions; SM: sensory-motor regions; FC: frontal cortex; and TP: temporal-parietal cortex
ST1: fetal (13 - 26 postconception weeks), ST2: early infancy to late childhood (4 months to 11 years), and ST3: adolescence to adulthood (13 - 23 years)
The bar shown representes the lower 25% and upper 25% of the expression distribution.
Top co-expressed genes in brain regions
| Top 10 positively co-expressed genes | ||
| Gene | Pearson's Correlation | Spearman's Correlation |
| CD276 | 0.89 | 0.90 |
| MOBKL2A | 0.88 | 0.85 |
| RFX1 | 0.88 | 0.86 |
| DCAF15 | 0.88 | 0.87 |
| SARM1 | 0.88 | 0.87 |
| MEN1 | 0.88 | 0.85 |
| EPHB2 | 0.87 | 0.86 |
| SEPN1 | 0.87 | 0.85 |
| UNK | 0.87 | 0.86 |
| WDR6 | 0.87 | 0.86 |
| Top 10 negatively co-expressed genes | ||
| Gene | Pearson's Correlation | Spearman's Correlation |
| C5orf53 | -0.69 | -0.76 |
| MT-CO2 | -0.67 | -0.78 |
| AF347015.27 | -0.67 | -0.79 |
| AF347015.31 | -0.65 | -0.77 |
| AF347015.33 | -0.65 | -0.77 |
| S100B | -0.64 | -0.73 |
| AF347015.8 | -0.64 | -0.78 |
| MT-CYB | -0.63 | -0.77 |
| FXYD1 | -0.62 | -0.72 |
| HLA-F | -0.61 | -0.64 |
Section V. Pathway annotation
| Pathway name | Pathway size | # SZGR 2.0 genes in pathway | Info |
|---|---|---|---|
| GINESTIER BREAST CANCER 20Q13 AMPLIFICATION UP | 119 | 66 | All SZGR 2.0 genes in this pathway |
| KINSEY TARGETS OF EWSR1 FLII FUSION UP | 1278 | 748 | All SZGR 2.0 genes in this pathway |
| NUYTTEN EZH2 TARGETS DN | 1024 | 594 | All SZGR 2.0 genes in this pathway |
| LIAO METASTASIS | 539 | 324 | All SZGR 2.0 genes in this pathway |
| NIKOLSKY BREAST CANCER 20Q12 Q13 AMPLICON | 149 | 76 | All SZGR 2.0 genes in this pathway |
| MCCABE BOUND BY HOXC6 | 469 | 239 | All SZGR 2.0 genes in this pathway |
| SMID BREAST CANCER BASAL DN | 701 | 446 | All SZGR 2.0 genes in this pathway |
| HAN SATB1 TARGETS DN | 442 | 275 | All SZGR 2.0 genes in this pathway |
| LU EZH2 TARGETS UP | 295 | 155 | All SZGR 2.0 genes in this pathway |
| PEDRIOLI MIR31 TARGETS UP | 221 | 120 | All SZGR 2.0 genes in this pathway |