Gene Page: RCOR3
Summary ?
| GeneID | 55758 |
| Symbol | RCOR3 |
| Synonyms | - |
| Description | REST corepressor 3 |
| Reference | HGNC:HGNC:25594|Ensembl:ENSG00000117625|HPRD:08338|Vega:OTTHUMG00000036996 |
| Gene type | protein-coding |
| Map location | 1q32.2 |
| Sherlock p-value | 0.318 |
| Fetal beta | 0.433 |
| DMG | 1 (# studies) |
Gene in Data Sources
| Gene set name | Method of gene set | Description | Info |
|---|---|---|---|
| CV:PGCnp | Genome-wide Association Study | GWAS | |
| DMG:Jaffe_2016 | Genome-wide DNA methylation analysis | This dataset includes 2,104 probes/CpGs associated with SZ patients (n=108) compared to 136 controls at Bonferroni-adjusted P < 0.05. | 1 |
Section I. Genetics and epigenetics annotation
 Differentially methylated gene
| Probe | Chromosome | Position | Nearest gene | P (dis) | Beta (dis) | FDR (dis) | Study |
|---|---|---|---|---|---|---|---|
| cg06939061 | 1 | 211432106 | RCOR3 | 4.15E-9 | -0.006 | 2.5E-6 | DMG:Jaffe_2016 |
Section II. Transcriptome annotation
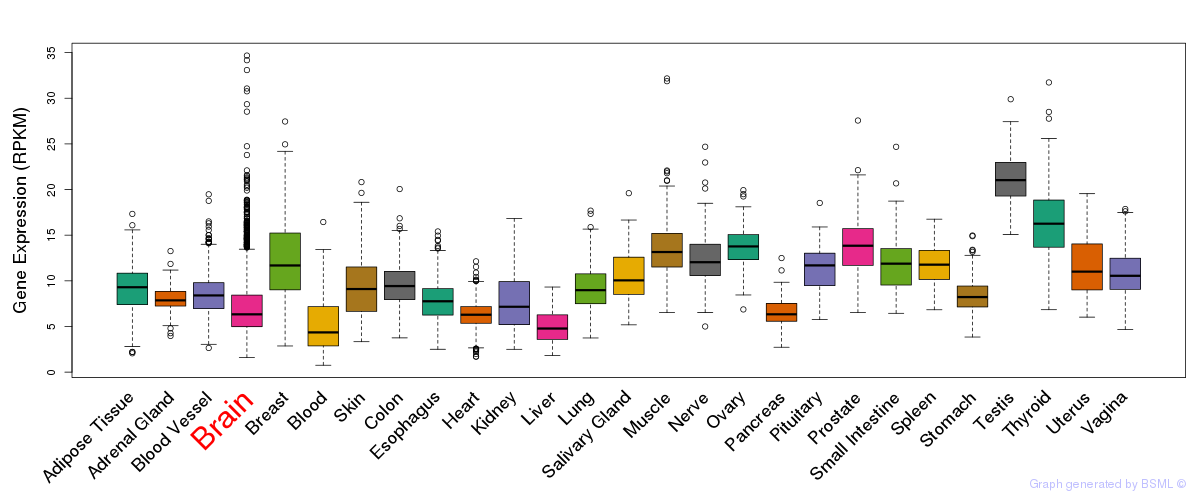
General gene expression (GTEx)
Gene expression during devlopment (BrainCloud)
Footnote:
A total of 269 time points ploted, with n=38 fetal samples (x=1:38). Each triangle represents one time point.
Gene expression of temporal and spatial changes (BrainSpan)
Footnote:
SC: sub-cortical regions; SM: sensory-motor regions; FC: frontal cortex; and TP: temporal-parietal cortex
ST1: fetal (13 - 26 postconception weeks), ST2: early infancy to late childhood (4 months to 11 years), and ST3: adolescence to adulthood (13 - 23 years)
The bar shown representes the lower 25% and upper 25% of the expression distribution.
Top co-expressed genes in brain regions
| Top 10 positively co-expressed genes | ||
| Gene | Pearson's Correlation | Spearman's Correlation |
| ENDOD1 | 0.95 | 0.89 |
| SLC12A2 | 0.94 | 0.86 |
| ENPP4 | 0.91 | 0.86 |
| LAMP2 | 0.90 | 0.88 |
| PRUNE2 | 0.90 | 0.87 |
| MITF | 0.90 | 0.84 |
| PXK | 0.90 | 0.78 |
| SYNJ2 | 0.89 | 0.73 |
| PLD1 | 0.89 | 0.79 |
| UGT8 | 0.89 | 0.78 |
| Top 10 negatively co-expressed genes | ||
| Gene | Pearson's Correlation | Spearman's Correlation |
| BCL7C | -0.52 | -0.68 |
| RPL36 | -0.50 | -0.68 |
| TBC1D10A | -0.50 | -0.46 |
| RPL35 | -0.50 | -0.66 |
| AC006276.2 | -0.49 | -0.55 |
| RPLP1 | -0.47 | -0.61 |
| NR2C2AP | -0.47 | -0.47 |
| RPL12 | -0.47 | -0.58 |
| RPL27 | -0.47 | -0.63 |
| PLEKHO1 | -0.46 | -0.48 |
Section V. Pathway annotation
| Pathway name | Pathway size | # SZGR 2.0 genes in pathway | Info |
|---|---|---|---|
| NAKAMURA TUMOR ZONE PERIPHERAL VS CENTRAL DN | 634 | 384 | All SZGR 2.0 genes in this pathway |
| ZHOU INFLAMMATORY RESPONSE LIVE DN | 384 | 220 | All SZGR 2.0 genes in this pathway |
| KIM WT1 TARGETS DN | 459 | 276 | All SZGR 2.0 genes in this pathway |
| MARTORIATI MDM4 TARGETS FETAL LIVER DN | 514 | 319 | All SZGR 2.0 genes in this pathway |
| BENPORATH SOX2 TARGETS | 734 | 436 | All SZGR 2.0 genes in this pathway |
| SHEN SMARCA2 TARGETS UP | 424 | 268 | All SZGR 2.0 genes in this pathway |
| MONNIER POSTRADIATION TUMOR ESCAPE DN | 373 | 196 | All SZGR 2.0 genes in this pathway |
| BOYAULT LIVER CANCER SUBCLASS G12 UP | 39 | 17 | All SZGR 2.0 genes in this pathway |
| CAIRO HEPATOBLASTOMA UP | 207 | 143 | All SZGR 2.0 genes in this pathway |
| WANG RESPONSE TO GSK3 INHIBITOR SB216763 UP | 397 | 206 | All SZGR 2.0 genes in this pathway |
| PLASARI TGFB1 SIGNALING VIA NFIC 1HR DN | 106 | 77 | All SZGR 2.0 genes in this pathway |
| FORTSCHEGGER PHF8 TARGETS UP | 279 | 155 | All SZGR 2.0 genes in this pathway |
| ZWANG DOWN BY 2ND EGF PULSE | 293 | 119 | All SZGR 2.0 genes in this pathway |