Gene Page: IFT122
Summary ?
| GeneID | 55764 |
| Symbol | IFT122 |
| Synonyms | CED|CED1|SPG|WDR10|WDR10p|WDR140 |
| Description | intraflagellar transport 122 |
| Reference | MIM:606045|HGNC:HGNC:13556|Ensembl:ENSG00000163913|HPRD:06922|Vega:OTTHUMG00000159516 |
| Gene type | protein-coding |
| Map location | 3q21 |
| Pascal p-value | 0.194 |
| Sherlock p-value | 0.125 |
| Fetal beta | -0.387 |
| DMG | 1 (# studies) |
| eGene | Caudate basal ganglia Cerebellar Hemisphere Cerebellum Frontal Cortex BA9 Nucleus accumbens basal ganglia Putamen basal ganglia Myers' cis & trans Meta |
Gene in Data Sources
| Gene set name | Method of gene set | Description | Info |
|---|---|---|---|
| CV:PGCnp | Genome-wide Association Study | GWAS | |
| DMG:Montano_2016 | Genome-wide DNA methylation analysis | This dataset includes 172 replicated associations between CpGs with schizophrenia. | 1 |
Section I. Genetics and epigenetics annotation
 Differentially methylated gene
| Probe | Chromosome | Position | Nearest gene | P (dis) | Beta (dis) | FDR (dis) | Study |
|---|---|---|---|---|---|---|---|
| cg19235307 | 3 | 129160154 | IFT122 | 6.25E-5 | -0.007 | 0.104 | DMG:Montano_2016 |
eQTL annotation
| SNP ID | Chromosome | Position | eGene | Gene Entrez ID | pvalue | qvalue | TSS distance | eQTL type |
|---|---|---|---|---|---|---|---|---|
| rs17248462 | chr20 | 29955446 | IFT122 | 55764 | 0.17 | trans | ||
| rs12631122 | 3 | 129119518 | IFT122 | ENSG00000163913.7 | 2.211E-6 | 0.01 | -39450 | gtex_brain_putamen_basal |
| rs35580429 | 3 | 129126873 | IFT122 | ENSG00000163913.7 | 8.634E-7 | 0.01 | -32095 | gtex_brain_putamen_basal |
| rs4429625 | 3 | 129139320 | IFT122 | ENSG00000163913.7 | 9.529E-7 | 0.01 | -19648 | gtex_brain_putamen_basal |
| rs10470431 | 3 | 129167243 | IFT122 | ENSG00000163913.7 | 1.01E-6 | 0.01 | 8275 | gtex_brain_putamen_basal |
| rs6789079 | 3 | 129180589 | IFT122 | ENSG00000163913.7 | 4.217E-7 | 0.01 | 21621 | gtex_brain_putamen_basal |
| rs7612530 | 3 | 129188325 | IFT122 | ENSG00000163913.7 | 1.01E-6 | 0.01 | 29357 | gtex_brain_putamen_basal |
| rs4640556 | 3 | 129206298 | IFT122 | ENSG00000163913.7 | 1.012E-6 | 0.01 | 47330 | gtex_brain_putamen_basal |
| rs3821914 | 3 | 129219987 | IFT122 | ENSG00000163913.7 | 1.012E-6 | 0.01 | 61019 | gtex_brain_putamen_basal |
| rs2713621 | 3 | 129224131 | IFT122 | ENSG00000163913.7 | 1.181E-6 | 0.01 | 65163 | gtex_brain_putamen_basal |
| rs397719625 | 3 | 129227651 | IFT122 | ENSG00000163913.7 | 1.227E-6 | 0.01 | 68683 | gtex_brain_putamen_basal |
| rs2260840 | 3 | 129234259 | IFT122 | ENSG00000163913.7 | 2.423E-6 | 0.01 | 75291 | gtex_brain_putamen_basal |
| rs111163508 | 3 | 129235423 | IFT122 | ENSG00000163913.7 | 1.144E-6 | 0.01 | 76455 | gtex_brain_putamen_basal |
| rs6439184 | 3 | 129237585 | IFT122 | ENSG00000163913.7 | 2.018E-6 | 0.01 | 78617 | gtex_brain_putamen_basal |
Section II. Transcriptome annotation
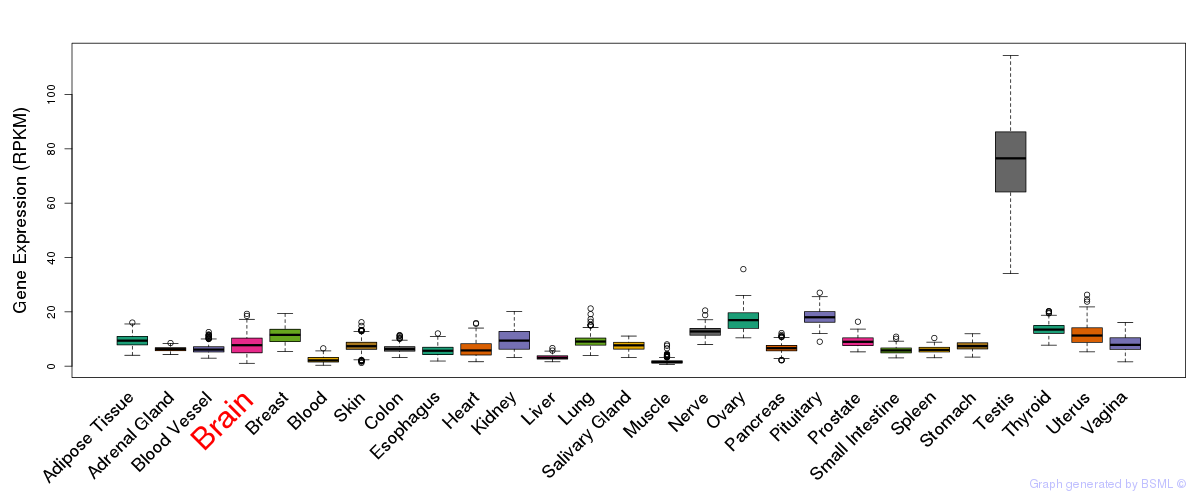
General gene expression (GTEx)
Gene expression during devlopment (BrainCloud)
Footnote:
A total of 269 time points ploted, with n=38 fetal samples (x=1:38). Each triangle represents one time point.
Gene expression of temporal and spatial changes (BrainSpan)
Footnote:
SC: sub-cortical regions; SM: sensory-motor regions; FC: frontal cortex; and TP: temporal-parietal cortex
ST1: fetal (13 - 26 postconception weeks), ST2: early infancy to late childhood (4 months to 11 years), and ST3: adolescence to adulthood (13 - 23 years)
The bar shown representes the lower 25% and upper 25% of the expression distribution.
Top co-expressed genes in brain regions
| Top 10 positively co-expressed genes | ||
| Gene | Pearson's Correlation | Spearman's Correlation |
| TMEM63A | 0.82 | 0.75 |
| ABCA2 | 0.81 | 0.64 |
| TTYH2 | 0.80 | 0.73 |
| ICOSLG | 0.80 | 0.73 |
| C11orf9 | 0.80 | 0.73 |
| GALNT6 | 0.79 | 0.70 |
| PCTK3 | 0.79 | 0.70 |
| PLXNB3 | 0.79 | 0.74 |
| FA2H | 0.78 | 0.71 |
| ERBB3 | 0.78 | 0.72 |
| Top 10 negatively co-expressed genes | ||
| Gene | Pearson's Correlation | Spearman's Correlation |
| NR2C2AP | -0.41 | -0.49 |
| KIAA1949 | -0.40 | -0.43 |
| TUBB2B | -0.40 | -0.49 |
| ALKBH2 | -0.39 | -0.48 |
| NKIRAS2 | -0.39 | -0.36 |
| RPL18 | -0.39 | -0.57 |
| PLEKHO1 | -0.39 | -0.47 |
| POLB | -0.39 | -0.47 |
| RPL12 | -0.39 | -0.53 |
| STMN1 | -0.39 | -0.42 |
Section V. Pathway annotation
| Pathway name | Pathway size | # SZGR 2.0 genes in pathway | Info |
|---|---|---|---|
| PARENT MTOR SIGNALING UP | 567 | 375 | All SZGR 2.0 genes in this pathway |
| DOANE RESPONSE TO ANDROGEN DN | 241 | 146 | All SZGR 2.0 genes in this pathway |
| DOANE BREAST CANCER ESR1 UP | 112 | 72 | All SZGR 2.0 genes in this pathway |
| GOZGIT ESR1 TARGETS DN | 781 | 465 | All SZGR 2.0 genes in this pathway |
| GRAESSMANN APOPTOSIS BY DOXORUBICIN DN | 1781 | 1082 | All SZGR 2.0 genes in this pathway |
| RICKMAN TUMOR DIFFERENTIATED WELL VS POORLY UP | 236 | 139 | All SZGR 2.0 genes in this pathway |
| IVANOVA HEMATOPOIESIS STEM CELL LONG TERM | 302 | 191 | All SZGR 2.0 genes in this pathway |
| CREIGHTON ENDOCRINE THERAPY RESISTANCE 2 | 473 | 224 | All SZGR 2.0 genes in this pathway |
| MARSON BOUND BY FOXP3 UNSTIMULATED | 1229 | 713 | All SZGR 2.0 genes in this pathway |
| HELLER HDAC TARGETS UP | 317 | 208 | All SZGR 2.0 genes in this pathway |
| SMID BREAST CANCER LUMINAL B UP | 172 | 109 | All SZGR 2.0 genes in this pathway |
| SMID BREAST CANCER BASAL DN | 701 | 446 | All SZGR 2.0 genes in this pathway |
| BERNARD PPAPDC1B TARGETS DN | 58 | 39 | All SZGR 2.0 genes in this pathway |
| PEDERSEN METASTASIS BY ERBB2 ISOFORM 7 | 403 | 240 | All SZGR 2.0 genes in this pathway |
| WAKABAYASHI ADIPOGENESIS PPARG BOUND 8D | 658 | 397 | All SZGR 2.0 genes in this pathway |
| RATTENBACHER BOUND BY CELF1 | 467 | 251 | All SZGR 2.0 genes in this pathway |