Gene Page: BDP1
Summary ?
| GeneID | 55814 |
| Symbol | BDP1 |
| Synonyms | HSA238520|TAF3B1|TFC5|TFIIIB''|TFIIIB150|TFIIIB90|TFNR |
| Description | B double prime 1, subunit of RNA polymerase III transcription initiation factor IIIB |
| Reference | MIM:607012|HGNC:HGNC:13652|Ensembl:ENSG00000145734|HPRD:06114|Vega:OTTHUMG00000162506 |
| Gene type | protein-coding |
| Map location | 5q13 |
| Pascal p-value | 0.466 |
| Fetal beta | 0.81 |
| DMG | 1 (# studies) |
| eGene | Myers' cis & trans |
Gene in Data Sources
| Gene set name | Method of gene set | Description | Info |
|---|---|---|---|
| CV:PGCnp | Genome-wide Association Study | GWAS | |
| DMG:Wockner_2014 | Genome-wide DNA methylation analysis | This dataset includes 4641 differentially methylated probes corresponding to 2929 unique genes between schizophrenia patients (n=24) and controls (n=24). | 2 |
Section I. Genetics and epigenetics annotation
 Differentially methylated gene
| Probe | Chromosome | Position | Nearest gene | P (dis) | Beta (dis) | FDR (dis) | Study |
|---|---|---|---|---|---|---|---|
| cg07851057 | 5 | 70751686 | BDP1 | 4.11E-7 | -0.437 | 0.006 | DMG:Wockner_2014 |
| cg22034268 | 5 | 70848529 | BDP1 | 1.67E-5 | 0.314 | 0.015 | DMG:Wockner_2014 |
 eQTL annotation
| SNP ID | Chromosome | Position | eGene | Gene Entrez ID | pvalue | qvalue | TSS distance | eQTL type |
|---|---|---|---|---|---|---|---|---|
| rs16829545 | chr2 | 151977407 | BDP1 | 55814 | 0.11 | trans | ||
| rs758989 | chr7 | 44203005 | BDP1 | 55814 | 0.06 | trans | ||
| rs1303722 | chr7 | 44219073 | BDP1 | 55814 | 0.19 | trans |
Section II. Transcriptome annotation
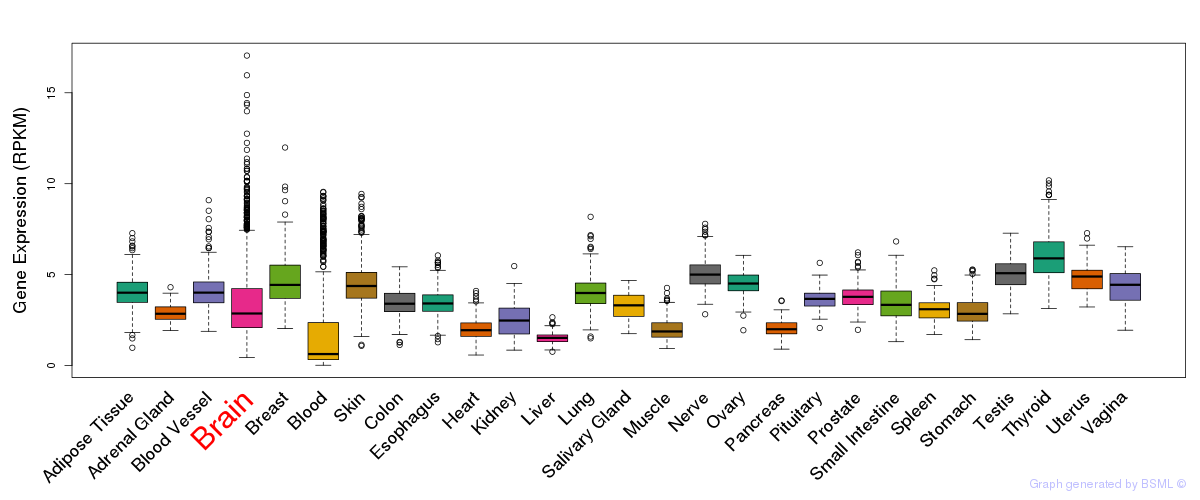
General gene expression (GTEx)

Gene expression during devlopment (BrainCloud)
Footnote:
A total of 269 time points ploted, with n=38 fetal samples (x=1:38). Each triangle represents one time point.
Gene expression of temporal and spatial changes (BrainSpan)
Footnote:
SC: sub-cortical regions; SM: sensory-motor regions; FC: frontal cortex; and TP: temporal-parietal cortex
ST1: fetal (13 - 26 postconception weeks), ST2: early infancy to late childhood (4 months to 11 years), and ST3: adolescence to adulthood (13 - 23 years)
The bar shown representes the lower 25% and upper 25% of the expression distribution.
Top co-expressed genes in brain regions
| Top 10 positively co-expressed genes | ||
| Gene | Pearson's Correlation | Spearman's Correlation |
| HELZ | 0.92 | 0.93 |
| UBN2 | 0.91 | 0.92 |
| SLC12A6 | 0.91 | 0.92 |
| BIRC6 | 0.91 | 0.91 |
| PCNX | 0.91 | 0.92 |
| KIAA1632 | 0.91 | 0.91 |
| KIAA2018 | 0.91 | 0.92 |
| KIF1B | 0.90 | 0.92 |
| CRKRS | 0.90 | 0.92 |
| HUWE1 | 0.90 | 0.90 |
| Top 10 negatively co-expressed genes | ||
| Gene | Pearson's Correlation | Spearman's Correlation |
| AF347015.31 | -0.69 | -0.77 |
| HIGD1B | -0.68 | -0.78 |
| MT-CO2 | -0.68 | -0.76 |
| IFI27 | -0.67 | -0.75 |
| AF347015.21 | -0.66 | -0.79 |
| FXYD1 | -0.66 | -0.74 |
| CXCL14 | -0.64 | -0.72 |
| CST3 | -0.64 | -0.74 |
| C1orf54 | -0.63 | -0.80 |
| S100A16 | -0.63 | -0.71 |
Section V. Pathway annotation
| Pathway name | Pathway size | # SZGR 2.0 genes in pathway | Info |
|---|---|---|---|
| SENESE HDAC1 TARGETS UP | 457 | 269 | All SZGR 2.0 genes in this pathway |
| SENESE HDAC3 TARGETS UP | 501 | 327 | All SZGR 2.0 genes in this pathway |
| WAMUNYOKOLI OVARIAN CANCER LMP UP | 265 | 158 | All SZGR 2.0 genes in this pathway |
| HAMAI APOPTOSIS VIA TRAIL UP | 584 | 356 | All SZGR 2.0 genes in this pathway |
| MARIADASON REGULATED BY HISTONE ACETYLATION DN | 54 | 30 | All SZGR 2.0 genes in this pathway |
| KRIGE RESPONSE TO TOSEDOSTAT 6HR DN | 911 | 527 | All SZGR 2.0 genes in this pathway |
| KRIGE RESPONSE TO TOSEDOSTAT 24HR DN | 1011 | 592 | All SZGR 2.0 genes in this pathway |
| JOHNSTONE PARVB TARGETS 3 DN | 918 | 550 | All SZGR 2.0 genes in this pathway |
| BILANGES SERUM SENSITIVE VIA TSC2 | 39 | 25 | All SZGR 2.0 genes in this pathway |