Gene Page: PSG2
Summary ?
| GeneID | 5670 |
| Symbol | PSG2 |
| Synonyms | CEA|PSBG2|PSG1 |
| Description | pregnancy specific beta-1-glycoprotein 2 |
| Reference | MIM:176391|HGNC:HGNC:9519|Ensembl:ENSG00000242221|HPRD:08891|Vega:OTTHUMG00000151547 |
| Gene type | protein-coding |
| Map location | 19q13.1-q13.2 |
| Pascal p-value | 0.791 |
| eGene | Myers' cis & trans |
| Support | CompositeSet |
Gene in Data Sources
| Gene set name | Method of gene set | Description | Info |
|---|---|---|---|
| CV:PGCnp | Genome-wide Association Study | GWAS | |
| DNM:Xu_2012 | Whole Exome Sequencing analysis | De novo mutations of 4 genes were identified by exome sequencing of 795 samples in this study |
Section I. Genetics and epigenetics annotation
 DNM table
| Gene | Chromosome | Position | Ref | Alt | Transcript | AA change | Mutation type | Sift | CG46 | Trait | Study |
|---|---|---|---|---|---|---|---|---|---|---|---|
| PSG2 | chr19 | 43579615 | C | A | NM_031246 | p.200R>S | missense | Schizophrenia | DNM:Xu_2012 |
eQTL annotation
| SNP ID | Chromosome | Position | eGene | Gene Entrez ID | pvalue | qvalue | TSS distance | eQTL type |
|---|---|---|---|---|---|---|---|---|
| rs2682594 | chr19 | 43940775 | PSG2 | 5670 | 0.19 | cis |
Section II. Transcriptome annotation
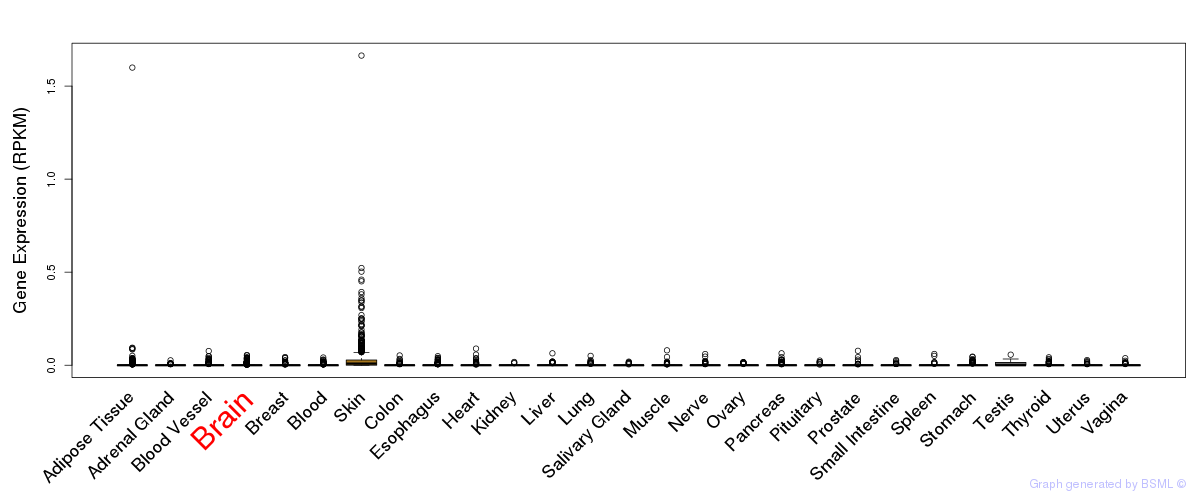
General gene expression (GTEx)
Gene expression of temporal and spatial changes (BrainSpan)
Footnote:
SC: sub-cortical regions; SM: sensory-motor regions; FC: frontal cortex; and TP: temporal-parietal cortex
ST1: fetal (13 - 26 postconception weeks), ST2: early infancy to late childhood (4 months to 11 years), and ST3: adolescence to adulthood (13 - 23 years)
The bar shown representes the lower 25% and upper 25% of the expression distribution.
Top co-expressed genes in brain regions
| Top 10 positively co-expressed genes | ||
| Gene | Pearson's Correlation | Spearman's Correlation |
| CHMP2A | 0.82 | 0.82 |
| COPS6 | 0.82 | 0.83 |
| LSM4 | 0.80 | 0.83 |
| HRAS | 0.80 | 0.80 |
| PSMD4 | 0.80 | 0.81 |
| PARK7 | 0.80 | 0.80 |
| AIP | 0.79 | 0.82 |
| RNF7 | 0.78 | 0.78 |
| PHB | 0.78 | 0.81 |
| SSU72 | 0.77 | 0.72 |
| Top 10 negatively co-expressed genes | ||
| Gene | Pearson's Correlation | Spearman's Correlation |
| AF347015.18 | -0.52 | -0.41 |
| MT-ATP8 | -0.52 | -0.45 |
| AF347015.8 | -0.51 | -0.41 |
| AF347015.2 | -0.49 | -0.42 |
| AF347015.26 | -0.49 | -0.42 |
| AF347015.15 | -0.48 | -0.42 |
| AF347015.21 | -0.48 | -0.38 |
| AF347015.33 | -0.48 | -0.43 |
| MT-CO2 | -0.45 | -0.37 |
| AF347015.27 | -0.45 | -0.41 |
Section V. Pathway annotation
| Pathway name | Pathway size | # SZGR 2.0 genes in pathway | Info |
|---|---|---|---|
| ODONNELL METASTASIS UP | 82 | 58 | All SZGR 2.0 genes in this pathway |
| MAGRANGEAS MULTIPLE MYELOMA IGG VS IGA UP | 22 | 12 | All SZGR 2.0 genes in this pathway |
| KYNG DNA DAMAGE BY GAMMA AND UV RADIATION | 88 | 65 | All SZGR 2.0 genes in this pathway |
| KYNG DNA DAMAGE DN | 195 | 135 | All SZGR 2.0 genes in this pathway |
| RIZKI TUMOR INVASIVENESS 3D DN | 270 | 181 | All SZGR 2.0 genes in this pathway |