Gene Page: PLEKHH1
Summary ?
| GeneID | 57475 |
| Symbol | PLEKHH1 |
| Synonyms | - |
| Description | pleckstrin homology, MyTH4 and FERM domain containing H1 |
| Reference | HGNC:HGNC:17733|Ensembl:ENSG00000054690|HPRD:17862|Vega:OTTHUMG00000171272 |
| Gene type | protein-coding |
| Map location | 14q24.1 |
| Pascal p-value | 0.327 |
| Sherlock p-value | 0.561 |
| Fetal beta | -1.038 |
| eGene | Cerebellar Hemisphere Myers' cis & trans |
| Support | CompositeSet |
Gene in Data Sources
| Gene set name | Method of gene set | Description | Info |
|---|---|---|---|
| CV:PGCnp | Genome-wide Association Study | GWAS | |
| DNM:Fromer_2014 | Whole Exome Sequencing analysis | This study reported a WES study of 623 schizophrenia trios, reporting DNMs using genomic DNA. |
Section I. Genetics and epigenetics annotation
 DNM table
| Gene | Chromosome | Position | Ref | Alt | Transcript | AA change | Mutation type | Sift | CG46 | Trait | Study |
|---|---|---|---|---|---|---|---|---|---|---|---|
| PLEKHH1 | chr14 | 68038547 | T | C | NM_020715 | p.505F>L | missense | Schizophrenia | DNM:Fromer_2014 |
eQTL annotation
| SNP ID | Chromosome | Position | eGene | Gene Entrez ID | pvalue | qvalue | TSS distance | eQTL type |
|---|---|---|---|---|---|---|---|---|
| rs6448932 | chr4 | 12595798 | PLEKHH1 | 57475 | 0.11 | trans | ||
| rs135853 | chr22 | 49978452 | PLEKHH1 | 57475 | 0.2 | trans |
Section II. Transcriptome annotation
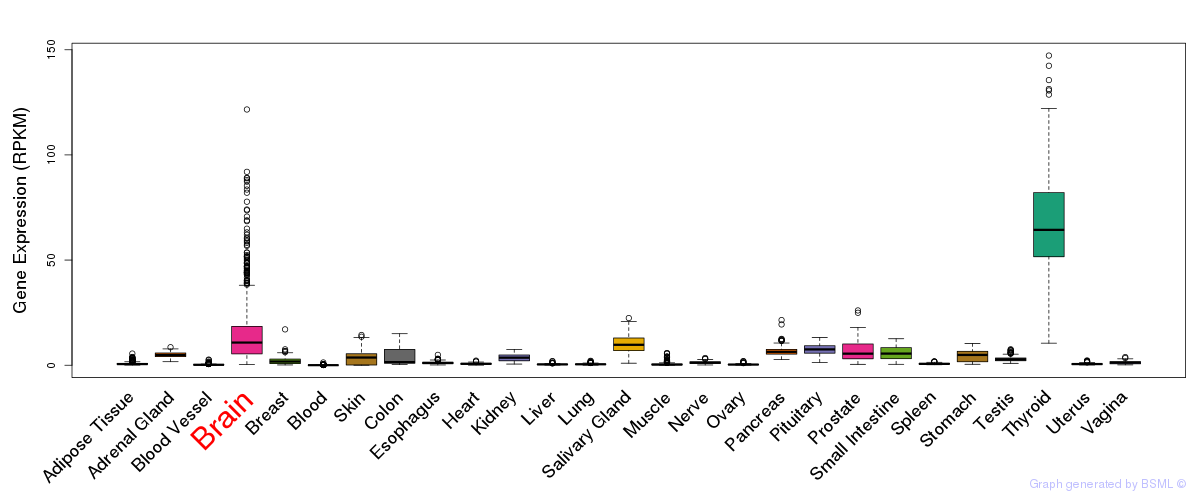
General gene expression (GTEx)
Gene expression during devlopment (BrainCloud)
Footnote:
A total of 269 time points ploted, with n=38 fetal samples (x=1:38). Each triangle represents one time point.
Gene expression of temporal and spatial changes (BrainSpan)
Footnote:
SC: sub-cortical regions; SM: sensory-motor regions; FC: frontal cortex; and TP: temporal-parietal cortex
ST1: fetal (13 - 26 postconception weeks), ST2: early infancy to late childhood (4 months to 11 years), and ST3: adolescence to adulthood (13 - 23 years)
The bar shown representes the lower 25% and upper 25% of the expression distribution.
Top co-expressed genes in brain regions
| Top 10 positively co-expressed genes | ||
| Gene | Pearson's Correlation | Spearman's Correlation |
| MICAL1 | 0.94 | 0.93 |
| ANO8 | 0.94 | 0.94 |
| LPAR2 | 0.94 | 0.89 |
| FBN3 | 0.94 | 0.89 |
| AC145098.2 | 0.93 | 0.93 |
| QRICH2 | 0.93 | 0.89 |
| B4GALNT4 | 0.92 | 0.95 |
| TAF1C | 0.92 | 0.92 |
| KIAA0895L | 0.92 | 0.90 |
| TRPV1 | 0.92 | 0.86 |
| Top 10 negatively co-expressed genes | ||
| Gene | Pearson's Correlation | Spearman's Correlation |
| C5orf53 | -0.64 | -0.73 |
| AF347015.27 | -0.63 | -0.79 |
| ACOT13 | -0.62 | -0.70 |
| AF347015.31 | -0.62 | -0.78 |
| S100B | -0.62 | -0.73 |
| HLA-F | -0.62 | -0.63 |
| B2M | -0.61 | -0.74 |
| ALDOC | -0.61 | -0.62 |
| FAM162A | -0.61 | -0.68 |
| ABCG2 | -0.61 | -0.65 |
Section V. Pathway annotation
| Pathway name | Pathway size | # SZGR 2.0 genes in pathway | Info |
|---|---|---|---|
| CHARAFE BREAST CANCER LUMINAL VS BASAL UP | 380 | 215 | All SZGR 2.0 genes in this pathway |
| ODONNELL TFRC TARGETS UP | 456 | 228 | All SZGR 2.0 genes in this pathway |
| SENESE HDAC1 TARGETS DN | 260 | 143 | All SZGR 2.0 genes in this pathway |
| SENESE HDAC1 AND HDAC2 TARGETS DN | 232 | 139 | All SZGR 2.0 genes in this pathway |
| WAMUNYOKOLI OVARIAN CANCER LMP UP | 265 | 158 | All SZGR 2.0 genes in this pathway |
| DODD NASOPHARYNGEAL CARCINOMA UP | 1821 | 933 | All SZGR 2.0 genes in this pathway |
| RODRIGUES THYROID CARCINOMA POORLY DIFFERENTIATED DN | 805 | 505 | All SZGR 2.0 genes in this pathway |
| RODRIGUES THYROID CARCINOMA ANAPLASTIC DN | 537 | 339 | All SZGR 2.0 genes in this pathway |
| WANG CISPLATIN RESPONSE AND XPC UP | 202 | 115 | All SZGR 2.0 genes in this pathway |
| KRIGE RESPONSE TO TOSEDOSTAT 6HR UP | 953 | 554 | All SZGR 2.0 genes in this pathway |
| KRIGE RESPONSE TO TOSEDOSTAT 24HR DN | 1011 | 592 | All SZGR 2.0 genes in this pathway |
| HUANG DASATINIB RESISTANCE DN | 69 | 44 | All SZGR 2.0 genes in this pathway |
| DUTERTRE ESTRADIOL RESPONSE 6HR UP | 229 | 149 | All SZGR 2.0 genes in this pathway |
| PANGAS TUMOR SUPPRESSION BY SMAD1 AND SMAD5 DN | 157 | 106 | All SZGR 2.0 genes in this pathway |
| BHAT ESR1 TARGETS NOT VIA AKT1 UP | 211 | 131 | All SZGR 2.0 genes in this pathway |
| BHAT ESR1 TARGETS VIA AKT1 UP | 281 | 183 | All SZGR 2.0 genes in this pathway |