Gene Page: ZSWIM5
Summary ?
| GeneID | 57643 |
| Symbol | ZSWIM5 |
| Synonyms | - |
| Description | zinc finger SWIM-type containing 5 |
| Reference | HGNC:HGNC:29299|Ensembl:ENSG00000162415|Vega:OTTHUMG00000008950 |
| Gene type | protein-coding |
| Map location | 1p34.1 |
| Pascal p-value | 0.547 |
| Sherlock p-value | 0.069 |
| Fetal beta | 2.121 |
| DMG | 1 (# studies) |
| eGene | Myers' cis & trans Meta |
Gene in Data Sources
| Gene set name | Method of gene set | Description | Info |
|---|---|---|---|
| CV:PGCnp | Genome-wide Association Study | GWAS | |
| DMG:Jaffe_2016 | Genome-wide DNA methylation analysis | This dataset includes 2,104 probes/CpGs associated with SZ patients (n=108) compared to 136 controls at Bonferroni-adjusted P < 0.05. | 1 |
| Expression | Meta-analysis of gene expression | P value: 1.51 |
Section I. Genetics and epigenetics annotation
 Differentially methylated gene
| Probe | Chromosome | Position | Nearest gene | P (dis) | Beta (dis) | FDR (dis) | Study |
|---|---|---|---|---|---|---|---|
| cg06408034 | 1 | 45671987 | ZSWIM5 | 1.06E-7 | -0.009 | 2.32E-5 | DMG:Jaffe_2016 |
eQTL annotation
| SNP ID | Chromosome | Position | eGene | Gene Entrez ID | pvalue | qvalue | TSS distance | eQTL type |
|---|---|---|---|---|---|---|---|---|
| rs16829545 | chr2 | 151977407 | ZSWIM5 | 57643 | 0 | trans | ||
| rs7584986 | chr2 | 184111432 | ZSWIM5 | 57643 | 0.01 | trans | ||
| rs2009378 | chr5 | 3004583 | ZSWIM5 | 57643 | 0.18 | trans | ||
| rs11139334 | chr9 | 84209393 | ZSWIM5 | 57643 | 0.05 | trans | ||
| rs16955618 | chr15 | 29937543 | ZSWIM5 | 57643 | 1.902E-6 | trans |
Section II. Transcriptome annotation
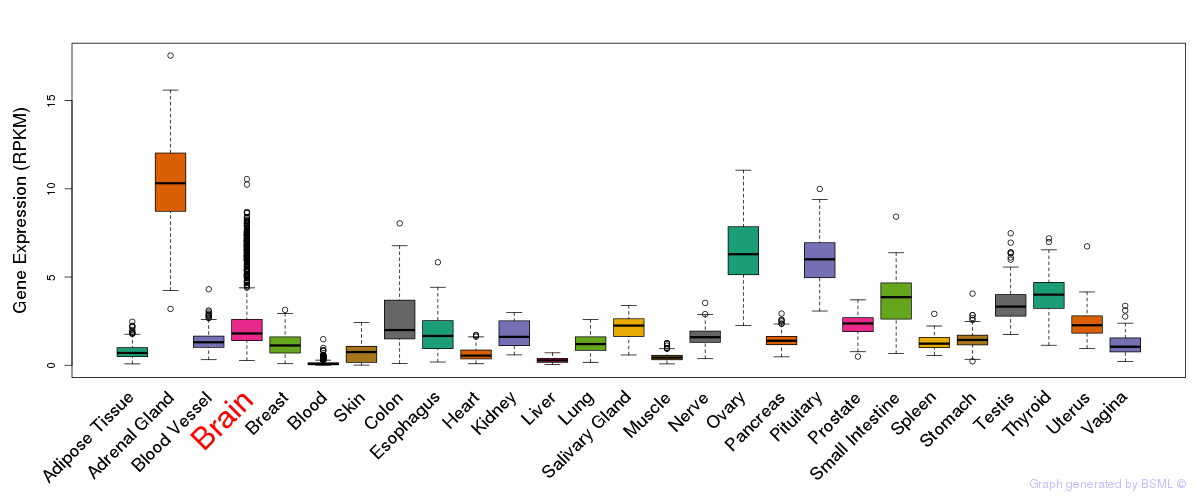
General gene expression (GTEx)
Gene expression during devlopment (BrainCloud)
Footnote:
A total of 269 time points ploted, with n=38 fetal samples (x=1:38). Each triangle represents one time point.
Gene expression of temporal and spatial changes (BrainSpan)
Footnote:
SC: sub-cortical regions; SM: sensory-motor regions; FC: frontal cortex; and TP: temporal-parietal cortex
ST1: fetal (13 - 26 postconception weeks), ST2: early infancy to late childhood (4 months to 11 years), and ST3: adolescence to adulthood (13 - 23 years)
The bar shown representes the lower 25% and upper 25% of the expression distribution.
Top co-expressed genes in brain regions
| Top 10 positively co-expressed genes | ||
| Gene | Pearson's Correlation | Spearman's Correlation |
| KIAA1045 | 0.94 | 0.91 |
| IQSEC2 | 0.93 | 0.91 |
| PITPNM2 | 0.93 | 0.89 |
| CBX6 | 0.92 | 0.89 |
| LRRK1 | 0.91 | 0.89 |
| KIAA0284 | 0.90 | 0.91 |
| PTPRN | 0.90 | 0.92 |
| HTR5A | 0.90 | 0.91 |
| PPP2R2C | 0.90 | 0.91 |
| DUSP3 | 0.89 | 0.85 |
| Top 10 negatively co-expressed genes | ||
| Gene | Pearson's Correlation | Spearman's Correlation |
| BCL7C | -0.49 | -0.55 |
| C9orf46 | -0.49 | -0.50 |
| RPL23A | -0.49 | -0.53 |
| GTF3C6 | -0.47 | -0.45 |
| C21orf57 | -0.46 | -0.47 |
| RPS19P3 | -0.45 | -0.52 |
| RPS6 | -0.45 | -0.47 |
| RPS13P2 | -0.45 | -0.42 |
| RPS12 | -0.45 | -0.54 |
| EXOSC8 | -0.45 | -0.38 |
Section III. Gene Ontology annotation
| Molecular function | GO term | Evidence | Neuro keywords | PubMed ID |
|---|---|---|---|---|
| GO:0008270 | zinc ion binding | IEA | - | |
| GO:0046872 | metal ion binding | IEA | - |
Section V. Pathway annotation
| Pathway name | Pathway size | # SZGR 2.0 genes in pathway | Info |
|---|---|---|---|
| DODD NASOPHARYNGEAL CARCINOMA UP | 1821 | 933 | All SZGR 2.0 genes in this pathway |
| LASTOWSKA NEUROBLASTOMA COPY NUMBER DN | 800 | 473 | All SZGR 2.0 genes in this pathway |
| NUYTTEN NIPP1 TARGETS UP | 769 | 437 | All SZGR 2.0 genes in this pathway |
| YAUCH HEDGEHOG SIGNALING PARACRINE DN | 264 | 159 | All SZGR 2.0 genes in this pathway |
| KRIEG HYPOXIA NOT VIA KDM3A | 770 | 480 | All SZGR 2.0 genes in this pathway |