Gene Page: SURF6
Summary ?
| GeneID | 6838 |
| Symbol | SURF6 |
| Synonyms | RRP14 |
| Description | surfeit 6 |
| Reference | MIM:185642|HGNC:HGNC:11478|HPRD:01714| |
| Gene type | protein-coding |
| Map location | 9q34.2 |
| Pascal p-value | 0.281 |
| Sherlock p-value | 0.002 |
| Fetal beta | -0.737 |
| eGene | Cerebellum Nucleus accumbens basal ganglia Myers' cis & trans Meta |
Gene in Data Sources
| Gene set name | Method of gene set | Description | Info |
|---|---|---|---|
| CV:PGCnp | Genome-wide Association Study | GWAS |
Section I. Genetics and epigenetics annotation
 eQTL annotation
| SNP ID | Chromosome | Position | eGene | Gene Entrez ID | pvalue | qvalue | TSS distance | eQTL type |
|---|---|---|---|---|---|---|---|---|
| rs4549850 | chr9 | 136265238 | SURF6 | 6838 | 0.13 | cis |
Section II. Transcriptome annotation
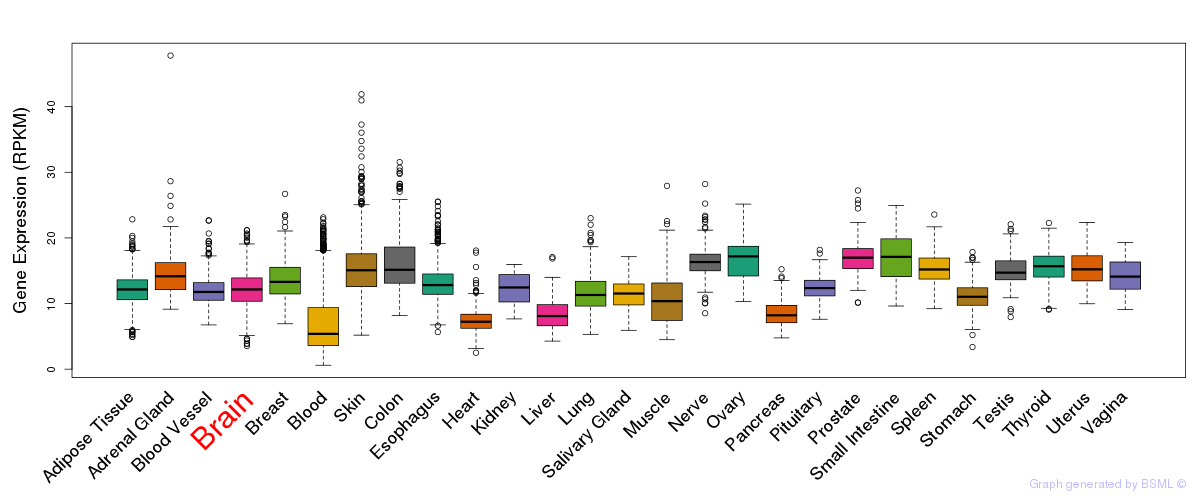
General gene expression (GTEx)
Gene expression during devlopment (BrainCloud)
Footnote:
A total of 269 time points ploted, with n=38 fetal samples (x=1:38). Each triangle represents one time point.
Gene expression of temporal and spatial changes (BrainSpan)
Footnote:
SC: sub-cortical regions; SM: sensory-motor regions; FC: frontal cortex; and TP: temporal-parietal cortex
ST1: fetal (13 - 26 postconception weeks), ST2: early infancy to late childhood (4 months to 11 years), and ST3: adolescence to adulthood (13 - 23 years)
The bar shown representes the lower 25% and upper 25% of the expression distribution.
Top co-expressed genes in brain regions
| Top 10 positively co-expressed genes | ||
| Gene | Pearson's Correlation | Spearman's Correlation |
| EPN1 | 0.91 | 0.90 |
| AGAP3 | 0.90 | 0.87 |
| KATNB1 | 0.89 | 0.86 |
| MED15 | 0.89 | 0.88 |
| SCYL1 | 0.89 | 0.86 |
| RNF126 | 0.88 | 0.87 |
| TBC1D17 | 0.88 | 0.86 |
| GSK3A | 0.88 | 0.84 |
| DYRK1B | 0.88 | 0.86 |
| HGS | 0.87 | 0.86 |
| Top 10 negatively co-expressed genes | ||
| Gene | Pearson's Correlation | Spearman's Correlation |
| AF347015.21 | -0.75 | -0.66 |
| MT-CO2 | -0.70 | -0.59 |
| AF347015.31 | -0.70 | -0.59 |
| AF347015.8 | -0.67 | -0.56 |
| NOSTRIN | -0.67 | -0.58 |
| GNG11 | -0.66 | -0.61 |
| AL139819.3 | -0.66 | -0.62 |
| MT-CYB | -0.66 | -0.55 |
| AF347015.18 | -0.65 | -0.55 |
| AF347015.27 | -0.64 | -0.58 |
Section V. Pathway annotation
| Pathway name | Pathway size | # SZGR 2.0 genes in pathway | Info |
|---|---|---|---|
| LIU SOX4 TARGETS DN | 309 | 191 | All SZGR 2.0 genes in this pathway |
| ZHOU INFLAMMATORY RESPONSE LIVE DN | 384 | 220 | All SZGR 2.0 genes in this pathway |
| WAMUNYOKOLI OVARIAN CANCER LMP UP | 265 | 158 | All SZGR 2.0 genes in this pathway |
| GRAESSMANN APOPTOSIS BY SERUM DEPRIVATION UP | 552 | 347 | All SZGR 2.0 genes in this pathway |
| RASHI RESPONSE TO IONIZING RADIATION 5 | 147 | 89 | All SZGR 2.0 genes in this pathway |
| BENPORATH MYC TARGETS WITH EBOX | 230 | 156 | All SZGR 2.0 genes in this pathway |
| IVANOVA HEMATOPOIESIS INTERMEDIATE PROGENITOR | 149 | 84 | All SZGR 2.0 genes in this pathway |
| DANG REGULATED BY MYC UP | 72 | 53 | All SZGR 2.0 genes in this pathway |
| DANG MYC TARGETS UP | 143 | 100 | All SZGR 2.0 genes in this pathway |
| DANG BOUND BY MYC | 1103 | 714 | All SZGR 2.0 genes in this pathway |