Gene Page: TFF2
Summary ?
| GeneID | 7032 |
| Symbol | TFF2 |
| Synonyms | SML1|SP |
| Description | trefoil factor 2 |
| Reference | MIM:182590|HGNC:HGNC:11756|Ensembl:ENSG00000160181|HPRD:01682|Vega:OTTHUMG00000086797 |
| Gene type | protein-coding |
| Map location | 21q22.3 |
| Pascal p-value | 0.458 |
| DMG | 1 (# studies) |
Gene in Data Sources
| Gene set name | Method of gene set | Description | Info |
|---|---|---|---|
| CV:GWASdb | Genome-wide Association Studies | GWASdb records for schizophrenia | |
| CV:PGCnp | Genome-wide Association Study | GWAS | |
| DMG:Wockner_2014 | Genome-wide DNA methylation analysis | This dataset includes 4641 differentially methylated probes corresponding to 2929 unique genes between schizophrenia patients (n=24) and controls (n=24). | 1 |
Section I. Genetics and epigenetics annotation
 Differentially methylated gene
| Probe | Chromosome | Position | Nearest gene | P (dis) | Beta (dis) | FDR (dis) | Study |
|---|---|---|---|---|---|---|---|
| cg18879389 | 21 | 43771120 | TFF2 | 4.45E-5 | -0.435 | 0.021 | DMG:Wockner_2014 |
Section II. Transcriptome annotation
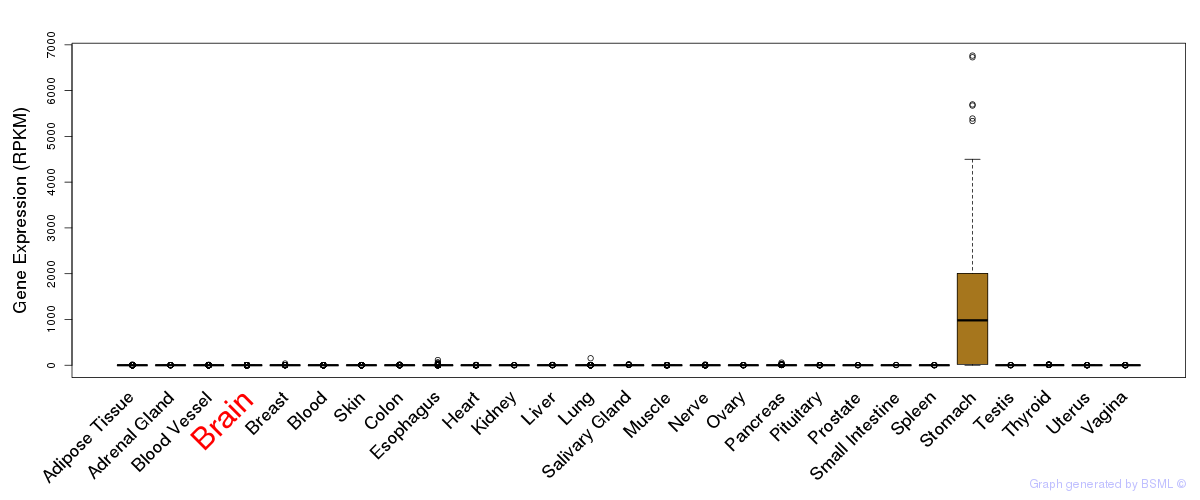
General gene expression (GTEx)
Gene expression of temporal and spatial changes (BrainSpan)
Footnote:
SC: sub-cortical regions; SM: sensory-motor regions; FC: frontal cortex; and TP: temporal-parietal cortex
ST1: fetal (13 - 26 postconception weeks), ST2: early infancy to late childhood (4 months to 11 years), and ST3: adolescence to adulthood (13 - 23 years)
The bar shown representes the lower 25% and upper 25% of the expression distribution.
Top co-expressed genes in brain regions
| Top 10 positively co-expressed genes | ||
| Gene | Pearson's Correlation | Spearman's Correlation |
| CDH5 | 0.81 | 0.80 |
| ENG | 0.80 | 0.82 |
| ESAM | 0.79 | 0.79 |
| ROBO4 | 0.79 | 0.79 |
| HSPA12B | 0.79 | 0.80 |
| NOS3 | 0.78 | 0.77 |
| SCARF1 | 0.77 | 0.79 |
| SOX17 | 0.77 | 0.77 |
| MFSD2 | 0.76 | 0.76 |
| LSR | 0.76 | 0.75 |
| Top 10 negatively co-expressed genes | ||
| Gene | Pearson's Correlation | Spearman's Correlation |
| MTIF3 | -0.51 | -0.55 |
| VRK2 | -0.47 | -0.53 |
| NDUFAF2 | -0.45 | -0.51 |
| OXSM | -0.45 | -0.51 |
| C8orf59 | -0.43 | -0.51 |
| C12orf45 | -0.42 | -0.47 |
| ZNF32 | -0.41 | -0.46 |
| CRYZL1 | -0.41 | -0.45 |
| SNHG12 | -0.41 | -0.38 |
| MRPS18C | -0.41 | -0.47 |
Section V. Pathway annotation
| Pathway name | Pathway size | # SZGR 2.0 genes in pathway | Info |
|---|---|---|---|
| VECCHI GASTRIC CANCER ADVANCED VS EARLY DN | 138 | 70 | All SZGR 2.0 genes in this pathway |
| SCHLOSSER SERUM RESPONSE AUGMENTED BY MYC | 108 | 74 | All SZGR 2.0 genes in this pathway |
| SHETH LIVER CANCER VS TXNIP LOSS PAM1 | 229 | 137 | All SZGR 2.0 genes in this pathway |
| PUJANA ATM PCC NETWORK | 1442 | 892 | All SZGR 2.0 genes in this pathway |
| NUYTTEN NIPP1 TARGETS DN | 848 | 527 | All SZGR 2.0 genes in this pathway |
| HELLER SILENCED BY METHYLATION UP | 282 | 183 | All SZGR 2.0 genes in this pathway |
| RIZKI TUMOR INVASIVENESS 3D DN | 270 | 181 | All SZGR 2.0 genes in this pathway |
| SMID BREAST CANCER BASAL UP | 648 | 398 | All SZGR 2.0 genes in this pathway |
| YAUCH HEDGEHOG SIGNALING PARACRINE DN | 264 | 159 | All SZGR 2.0 genes in this pathway |
| YOSHIMURA MAPK8 TARGETS DN | 366 | 257 | All SZGR 2.0 genes in this pathway |
| MARTENS TRETINOIN RESPONSE UP | 857 | 456 | All SZGR 2.0 genes in this pathway |
| BHAT ESR1 TARGETS NOT VIA AKT1 UP | 211 | 131 | All SZGR 2.0 genes in this pathway |
| BHAT ESR1 TARGETS VIA AKT1 UP | 281 | 183 | All SZGR 2.0 genes in this pathway |
| CERIBELLI PROMOTERS INACTIVE AND BOUND BY NFY | 44 | 20 | All SZGR 2.0 genes in this pathway |
| FEVR CTNNB1 TARGETS UP | 682 | 433 | All SZGR 2.0 genes in this pathway |
| ZWANG TRANSIENTLY UP BY 2ND EGF PULSE ONLY | 1725 | 838 | All SZGR 2.0 genes in this pathway |