Gene Page: TTC4
Summary ?
| GeneID | 7268 |
| Symbol | TTC4 |
| Synonyms | - |
| Description | tetratricopeptide repeat domain 4 |
| Reference | MIM:606753|HGNC:HGNC:12394|Ensembl:ENSG00000243725|HPRD:08417|Vega:OTTHUMG00000009914 |
| Gene type | protein-coding |
| Map location | 1p32.3 |
| Pascal p-value | 0.273 |
| Sherlock p-value | 0.261 |
| Fetal beta | -0.07 |
| eGene | Myers' cis & trans |
| Support | CompositeSet |
Gene in Data Sources
| Gene set name | Method of gene set | Description | Info |
|---|---|---|---|
| DNM:Fromer_2014 | Whole Exome Sequencing analysis | This study reported a WES study of 623 schizophrenia trios, reporting DNMs using genomic DNA. |
Section I. Genetics and epigenetics annotation
 DNM table
| Gene | Chromosome | Position | Ref | Alt | Transcript | AA change | Mutation type | Sift | CG46 | Trait | Study |
|---|---|---|---|---|---|---|---|---|---|---|---|
| TTC4 | chr1 | 55194020 | G | A | NM_004623 NM_004623 NR_037639 NR_037639 NR_037640 NR_037640 NR_037641 NR_037641 | . p.199R>Q . . . . . . | splice missense npcRNA splice npcRNA splice npcRNA splice | Schizophrenia | DNM:Fromer_2014 |
eQTL annotation
| SNP ID | Chromosome | Position | eGene | Gene Entrez ID | pvalue | qvalue | TSS distance | eQTL type |
|---|---|---|---|---|---|---|---|---|
| rs10489663 | chr1 | 55186685 | TTC4 | 7268 | 0.01 | cis | ||
| rs6698255 | chr1 | 55212718 | TTC4 | 7268 | 0.01 | cis |
Section II. Transcriptome annotation
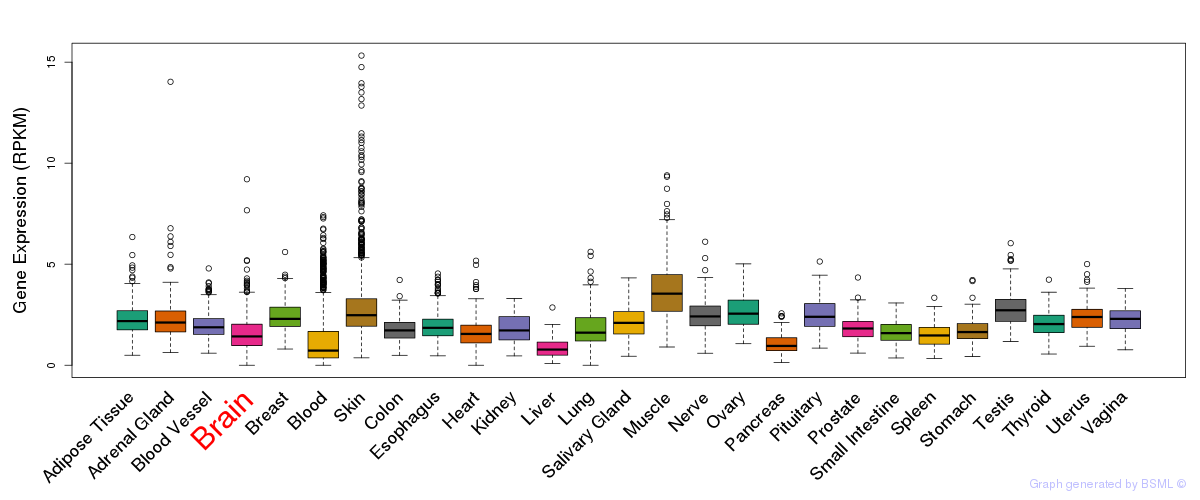
General gene expression (GTEx)
Gene expression during devlopment (BrainCloud)
Footnote:
A total of 269 time points ploted, with n=38 fetal samples (x=1:38). Each triangle represents one time point.
Gene expression of temporal and spatial changes (BrainSpan)
Footnote:
SC: sub-cortical regions; SM: sensory-motor regions; FC: frontal cortex; and TP: temporal-parietal cortex
ST1: fetal (13 - 26 postconception weeks), ST2: early infancy to late childhood (4 months to 11 years), and ST3: adolescence to adulthood (13 - 23 years)
The bar shown representes the lower 25% and upper 25% of the expression distribution.
Top co-expressed genes in brain regions
| Top 10 positively co-expressed genes | ||
| Gene | Pearson's Correlation | Spearman's Correlation |
| RPL13 | 0.95 | 0.94 |
| RPLP2 | 0.95 | 0.94 |
| RPS15P5 | 0.95 | 0.91 |
| RPL32 | 0.94 | 0.93 |
| RPS19P3 | 0.94 | 0.89 |
| RPS11P5 | 0.94 | 0.93 |
| RPL13A | 0.93 | 0.92 |
| RPL29 | 0.93 | 0.94 |
| RPLP1 | 0.93 | 0.92 |
| RPL19P12 | 0.93 | 0.94 |
| Top 10 negatively co-expressed genes | ||
| Gene | Pearson's Correlation | Spearman's Correlation |
| APOL1 | -0.56 | -0.72 |
| ABCB1 | -0.55 | -0.67 |
| ABCG2 | -0.55 | -0.66 |
| EPB41L2 | -0.55 | -0.68 |
| AF347015.27 | -0.54 | -0.71 |
| SYNM | -0.53 | -0.65 |
| PTPRB | -0.53 | -0.64 |
| SLC6A12 | -0.53 | -0.68 |
| APOL3 | -0.53 | -0.71 |
| AF347015.33 | -0.53 | -0.71 |
Section V. Pathway annotation
| Pathway name | Pathway size | # SZGR 2.0 genes in pathway | Info |
|---|---|---|---|
| BENPORATH MYC MAX TARGETS | 775 | 494 | All SZGR 2.0 genes in this pathway |
| DANG BOUND BY MYC | 1103 | 714 | All SZGR 2.0 genes in this pathway |