Gene Page: ZFYVE21
Summary ?
| GeneID | 79038 |
| Symbol | ZFYVE21 |
| Synonyms | HCVP7TP1|ZF21 |
| Description | zinc finger FYVE-type containing 21 |
| Reference | MIM:613504|HGNC:HGNC:20760|Ensembl:ENSG00000100711|HPRD:15733|Vega:OTTHUMG00000171651 |
| Gene type | protein-coding |
| Map location | 14q32.33 |
| Pascal p-value | 5.156E-12 |
| Sherlock p-value | 0.255 |
| Fetal beta | -1.067 |
| DMG | 1 (# studies) |
Gene in Data Sources
| Gene set name | Method of gene set | Description | Info |
|---|---|---|---|
| CV:PGCnp | Genome-wide Association Study | GWAS | |
| DMG:Wockner_2014 | Genome-wide DNA methylation analysis | This dataset includes 4641 differentially methylated probes corresponding to 2929 unique genes between schizophrenia patients (n=24) and controls (n=24). | 1 |
Section I. Genetics and epigenetics annotation
 Differentially methylated gene
| Probe | Chromosome | Position | Nearest gene | P (dis) | Beta (dis) | FDR (dis) | Study |
|---|---|---|---|---|---|---|---|
| cg04984818 | 14 | 104195301 | ZFYVE21 | 5.506E-4 | 0.467 | 0.049 | DMG:Wockner_2014 |
Section II. Transcriptome annotation
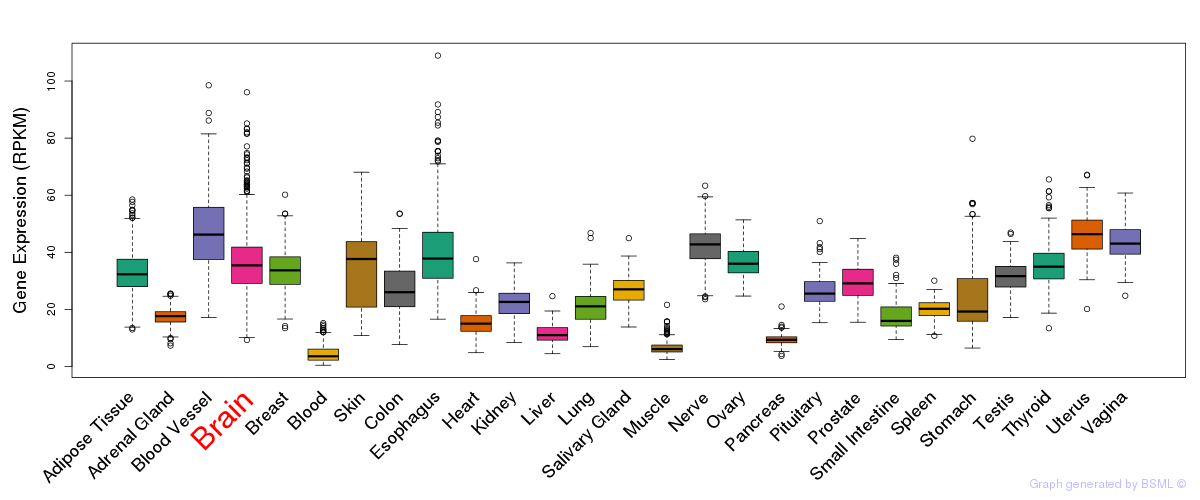
General gene expression (GTEx)
Gene expression during devlopment (BrainCloud)
Footnote:
A total of 269 time points ploted, with n=38 fetal samples (x=1:38). Each triangle represents one time point.
Gene expression of temporal and spatial changes (BrainSpan)
Footnote:
SC: sub-cortical regions; SM: sensory-motor regions; FC: frontal cortex; and TP: temporal-parietal cortex
ST1: fetal (13 - 26 postconception weeks), ST2: early infancy to late childhood (4 months to 11 years), and ST3: adolescence to adulthood (13 - 23 years)
The bar shown representes the lower 25% and upper 25% of the expression distribution.
Top co-expressed genes in brain regions
| Top 10 positively co-expressed genes | ||
| Gene | Pearson's Correlation | Spearman's Correlation |
| AXIN1 | 0.96 | 0.95 |
| ZNF446 | 0.96 | 0.96 |
| GMIP | 0.96 | 0.95 |
| KIAA1543 | 0.95 | 0.95 |
| MAST2 | 0.95 | 0.96 |
| CCDC120 | 0.95 | 0.96 |
| GPSM1 | 0.95 | 0.95 |
| AD000671.1 | 0.95 | 0.94 |
| AC145098.2 | 0.95 | 0.96 |
| MTA1 | 0.95 | 0.96 |
| Top 10 negatively co-expressed genes | ||
| Gene | Pearson's Correlation | Spearman's Correlation |
| AF347015.31 | -0.74 | -0.89 |
| AF347015.27 | -0.73 | -0.88 |
| C5orf53 | -0.72 | -0.75 |
| MT-CO2 | -0.72 | -0.87 |
| AF347015.33 | -0.71 | -0.84 |
| S100B | -0.71 | -0.81 |
| HLA-F | -0.71 | -0.72 |
| COPZ2 | -0.71 | -0.80 |
| AIFM3 | -0.70 | -0.72 |
| MT-CYB | -0.70 | -0.85 |
Section V. Pathway annotation
| Pathway name | Pathway size | # SZGR 2.0 genes in pathway | Info |
|---|---|---|---|
| SENGUPTA NASOPHARYNGEAL CARCINOMA DN | 349 | 157 | All SZGR 2.0 genes in this pathway |
| DODD NASOPHARYNGEAL CARCINOMA UP | 1821 | 933 | All SZGR 2.0 genes in this pathway |
| RODRIGUES THYROID CARCINOMA POORLY DIFFERENTIATED DN | 805 | 505 | All SZGR 2.0 genes in this pathway |
| RODRIGUES THYROID CARCINOMA ANAPLASTIC DN | 537 | 339 | All SZGR 2.0 genes in this pathway |
| GRAESSMANN APOPTOSIS BY DOXORUBICIN UP | 1142 | 669 | All SZGR 2.0 genes in this pathway |
| GRAESSMANN RESPONSE TO MC AND DOXORUBICIN UP | 612 | 367 | All SZGR 2.0 genes in this pathway |
| SCHAEFFER PROSTATE DEVELOPMENT 48HR UP | 487 | 286 | All SZGR 2.0 genes in this pathway |
| BRUINS UVC RESPONSE MIDDLE | 98 | 56 | All SZGR 2.0 genes in this pathway |
| WAKABAYASHI ADIPOGENESIS PPARG RXRA BOUND 8D | 882 | 506 | All SZGR 2.0 genes in this pathway |