Gene Page: LRFN3
Summary ?
| GeneID | 79414 |
| Symbol | LRFN3 |
| Synonyms | FIGLER1|SALM4 |
| Description | leucine rich repeat and fibronectin type III domain containing 3 |
| Reference | MIM:612809|HGNC:HGNC:28370|Ensembl:ENSG00000126243|HPRD:14309| |
| Gene type | protein-coding |
| Map location | 19q13.12 |
| Pascal p-value | 0.256 |
| Sherlock p-value | 0.825 |
| Fetal beta | -0.616 |
| DMG | 2 (# studies) |
| Support | Ascano FMRP targets |
Gene in Data Sources
| Gene set name | Method of gene set | Description | Info |
|---|---|---|---|
| CV:PGCnp | Genome-wide Association Study | GWAS | |
| DMG:Montano_2016 | Genome-wide DNA methylation analysis | This dataset includes 172 replicated associations between CpGs with schizophrenia. | 4 |
| DMG:vanEijk_2014 | Genome-wide DNA methylation analysis | This dataset includes 432 differentially methylated CpG sites corresponding to 391 unique transcripts between schizophrenia patients (n=260) and unaffected controls (n=250). | 4 |
Section I. Genetics and epigenetics annotation
 Differentially methylated gene
| Probe | Chromosome | Position | Nearest gene | P (dis) | Beta (dis) | FDR (dis) | Study |
|---|---|---|---|---|---|---|---|
| cg09778958 | 19 | 36427721 | LRFN3 | 1.46E-4 | -0.006 | 0.139 | DMG:Montano_2016 |
| cg00739120 | 19 | 36035875 | LRFN3 | 1.318E-4 | 5.762 | DMG:vanEijk_2014 | |
| cg03548857 | 19 | 35940174 | LRFN3 | 8.31E-5 | 4.738 | DMG:vanEijk_2014 | |
| cg08539991 | 19 | 36203832 | LRFN3 | 6.62E-8 | -5.437 | DMG:vanEijk_2014 |
Section II. Transcriptome annotation
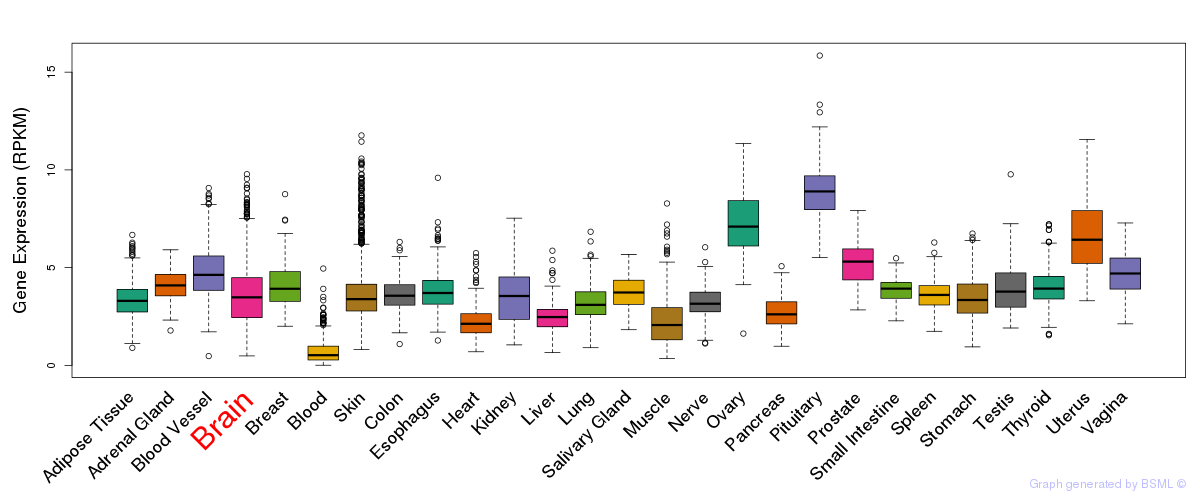
General gene expression (GTEx)
Gene expression during devlopment (BrainCloud)
Footnote:
A total of 269 time points ploted, with n=38 fetal samples (x=1:38). Each triangle represents one time point.
Gene expression of temporal and spatial changes (BrainSpan)
Footnote:
SC: sub-cortical regions; SM: sensory-motor regions; FC: frontal cortex; and TP: temporal-parietal cortex
ST1: fetal (13 - 26 postconception weeks), ST2: early infancy to late childhood (4 months to 11 years), and ST3: adolescence to adulthood (13 - 23 years)
The bar shown representes the lower 25% and upper 25% of the expression distribution.
Top co-expressed genes in brain regions
| Top 10 positively co-expressed genes | ||
| Gene | Pearson's Correlation | Spearman's Correlation |
| MTCP1NB | 0.81 | 0.73 |
| IMMP1L | 0.78 | 0.74 |
| MORN2 | 0.78 | 0.77 |
| RP11-884K10.1 | 0.77 | 0.70 |
| MRPS28 | 0.77 | 0.70 |
| UBL5 | 0.76 | 0.66 |
| TMBIM4 | 0.76 | 0.66 |
| C8orf59 | 0.76 | 0.67 |
| TMEM126A | 0.75 | 0.63 |
| PXMP3 | 0.75 | 0.70 |
| Top 10 negatively co-expressed genes | ||
| Gene | Pearson's Correlation | Spearman's Correlation |
| LRP1 | -0.53 | -0.50 |
| SLC6A6 | -0.52 | -0.50 |
| MLL2 | -0.52 | -0.53 |
| ATN1 | -0.51 | -0.49 |
| MYO18A | -0.51 | -0.44 |
| TULP4 | -0.50 | -0.48 |
| SRCAP | -0.50 | -0.49 |
| HERC2 | -0.50 | -0.47 |
| NDST1 | -0.50 | -0.45 |
| MPRIP | -0.50 | -0.46 |
Section V. Pathway annotation
| Pathway name | Pathway size | # SZGR 2.0 genes in pathway | Info |
|---|---|---|---|
| NUYTTEN EZH2 TARGETS UP | 1037 | 673 | All SZGR 2.0 genes in this pathway |
| BENPORATH NANOG TARGETS | 988 | 594 | All SZGR 2.0 genes in this pathway |
| BENPORATH OCT4 TARGETS | 290 | 172 | All SZGR 2.0 genes in this pathway |
| BENPORATH SOX2 TARGETS | 734 | 436 | All SZGR 2.0 genes in this pathway |
| BENPORATH NOS TARGETS | 179 | 105 | All SZGR 2.0 genes in this pathway |
| MARTENS TRETINOIN RESPONSE UP | 857 | 456 | All SZGR 2.0 genes in this pathway |
| VERHAAK GLIOBLASTOMA CLASSICAL | 162 | 122 | All SZGR 2.0 genes in this pathway |
| FOSTER KDM1A TARGETS DN | 211 | 119 | All SZGR 2.0 genes in this pathway |