Gene Page: SELO
Summary ?
| GeneID | 83642 |
| Symbol | SELO |
| Synonyms | - |
| Description | selenoprotein O |
| Reference | MIM:607917|Ensembl:ENSG00000073169|HPRD:07449|Vega:OTTHUMG00000044645 |
| Gene type | protein-coding |
| Map location | 22q13.33 |
| Pascal p-value | 0.076 |
| Sherlock p-value | 0.255 |
| Fetal beta | -0.198 |
| DMG | 1 (# studies) |
| eGene | Cerebellar Hemisphere Cerebellum Myers' cis & trans |
Gene in Data Sources
| Gene set name | Method of gene set | Description | Info |
|---|---|---|---|
| CV:PGCnp | Genome-wide Association Study | GWAS | |
| DMG:Jaffe_2016 | Genome-wide DNA methylation analysis | This dataset includes 2,104 probes/CpGs associated with SZ patients (n=108) compared to 136 controls at Bonferroni-adjusted P < 0.05. | 1 |
Section I. Genetics and epigenetics annotation
 Differentially methylated gene
| Probe | Chromosome | Position | Nearest gene | P (dis) | Beta (dis) | FDR (dis) | Study |
|---|---|---|---|---|---|---|---|
| cg27194081 | 22 | 50640274 | SELO | 1.13E-8 | -0.008 | 4.75E-6 | DMG:Jaffe_2016 |
eQTL annotation
| SNP ID | Chromosome | Position | eGene | Gene Entrez ID | pvalue | qvalue | TSS distance | eQTL type |
|---|---|---|---|---|---|---|---|---|
| rs16829545 | chr2 | 151977407 | SELO | 83642 | 2.154E-6 | trans | ||
| rs3845734 | chr2 | 171125572 | SELO | 83642 | 0.02 | trans | ||
| rs7584986 | chr2 | 184111432 | SELO | 83642 | 0.04 | trans | ||
| rs17762315 | chr5 | 76807576 | SELO | 83642 | 0.09 | trans | ||
| rs1929780 | chr6 | 40757438 | SELO | 83642 | 0.17 | trans | ||
| rs7787830 | chr7 | 98797019 | SELO | 83642 | 0.17 | trans | ||
| rs7141486 | 0 | SELO | 83642 | 0.14 | trans | |||
| rs16955618 | chr15 | 29937543 | SELO | 83642 | 9.334E-11 | trans | ||
| rs1041786 | chr21 | 22617710 | SELO | 83642 | 0.03 | trans |
Section II. Transcriptome annotation
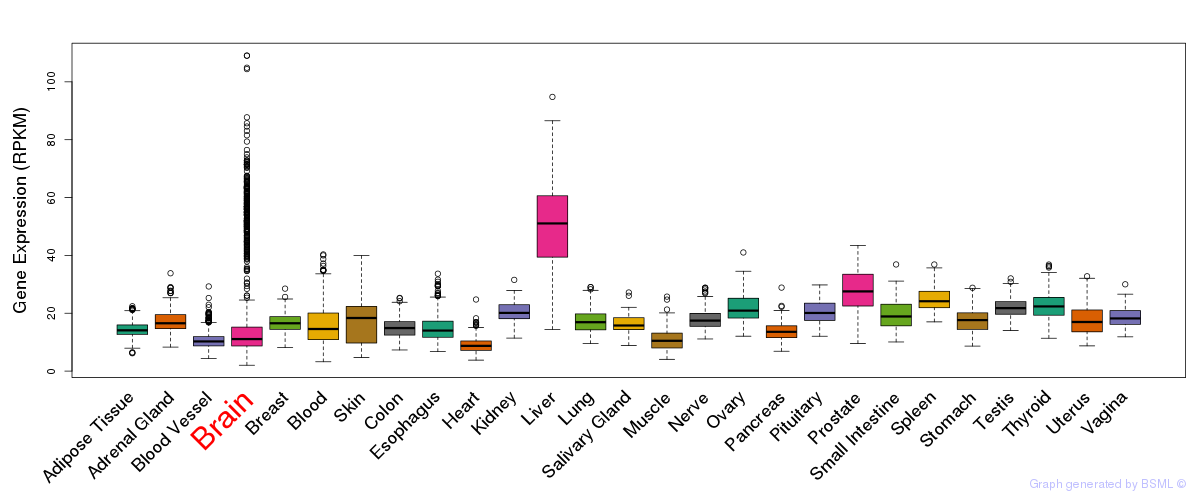
General gene expression (GTEx)
Gene expression during devlopment (BrainCloud)
Footnote:
A total of 269 time points ploted, with n=38 fetal samples (x=1:38). Each triangle represents one time point.
Gene expression of temporal and spatial changes (BrainSpan)
Footnote:
SC: sub-cortical regions; SM: sensory-motor regions; FC: frontal cortex; and TP: temporal-parietal cortex
ST1: fetal (13 - 26 postconception weeks), ST2: early infancy to late childhood (4 months to 11 years), and ST3: adolescence to adulthood (13 - 23 years)
The bar shown representes the lower 25% and upper 25% of the expression distribution.
No co-expressed genes in brain regions
Section V. Pathway annotation
| Pathway name | Pathway size | # SZGR 2.0 genes in pathway | Info |
|---|---|---|---|
| GARY CD5 TARGETS UP | 473 | 314 | All SZGR 2.0 genes in this pathway |
| NIKOLSKY BREAST CANCER 22Q13 AMPLICON | 17 | 15 | All SZGR 2.0 genes in this pathway |
| ACEVEDO LIVER CANCER DN | 540 | 340 | All SZGR 2.0 genes in this pathway |
| BOCHKIS FOXA2 TARGETS | 425 | 261 | All SZGR 2.0 genes in this pathway |
| CHIANG LIVER CANCER SUBCLASS PROLIFERATION DN | 179 | 97 | All SZGR 2.0 genes in this pathway |