Gene Page: FKBP6
Summary ?
| GeneID | 8468 |
| Symbol | FKBP6 |
| Synonyms | FKBP36 |
| Description | FK506 binding protein 6 |
| Reference | MIM:604839|HGNC:HGNC:3722|Ensembl:ENSG00000077800|HPRD:05326|Vega:OTTHUMG00000150520 |
| Gene type | protein-coding |
| Map location | 7q11.23 |
| Pascal p-value | 0.679 |
| Fetal beta | -0.094 |
Gene in Data Sources
| Gene set name | Method of gene set | Description | Info |
|---|---|---|---|
| CNV:YES | Copy number variation studies | Manual curation | |
| CV:PGCnp | Genome-wide Association Study | GWAS | |
| DMG:Wockner_2014 | Genome-wide DNA methylation analysis | This dataset includes 4641 differentially methylated probes corresponding to 2929 unique genes between schizophrenia patients (n=24) and controls (n=24). | 1 |
Section I. Genetics and epigenetics annotation
 Differentially methylated gene
| Probe | Chromosome | Position | Nearest gene | P (dis) | Beta (dis) | FDR (dis) | Study |
|---|---|---|---|---|---|---|---|
| cg22458401 | 7 | 72742115 | TRIM50;FKBP6 | 5.563E-4 | 0.264 | 0.049 | DMG:Wockner_2014 |
Section II. Transcriptome annotation
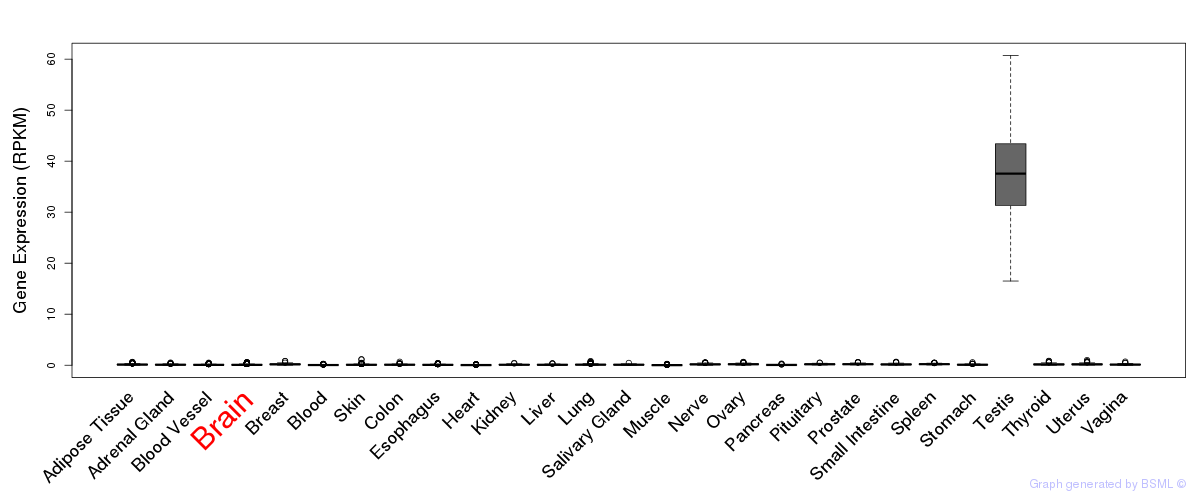
General gene expression (GTEx)
Gene expression during devlopment (BrainCloud)
Footnote:
A total of 269 time points ploted, with n=38 fetal samples (x=1:38). Each triangle represents one time point.
Gene expression of temporal and spatial changes (BrainSpan)
Footnote:
SC: sub-cortical regions; SM: sensory-motor regions; FC: frontal cortex; and TP: temporal-parietal cortex
ST1: fetal (13 - 26 postconception weeks), ST2: early infancy to late childhood (4 months to 11 years), and ST3: adolescence to adulthood (13 - 23 years)
The bar shown representes the lower 25% and upper 25% of the expression distribution.
Top co-expressed genes in brain regions
| Top 10 positively co-expressed genes | ||
| Gene | Pearson's Correlation | Spearman's Correlation |
| RNF220 | 0.83 | 0.67 |
| FUT1 | 0.83 | 0.65 |
| BRUNOL4 | 0.77 | 0.82 |
| PROX1 | 0.77 | 0.50 |
| ZIC1 | 0.76 | 0.31 |
| C20orf100 | 0.76 | 0.75 |
| COL23A1 | 0.75 | 0.56 |
| FZD10 | 0.75 | 0.41 |
| TCF7L2 | 0.74 | 0.37 |
| ZIC2 | 0.74 | 0.31 |
| Top 10 negatively co-expressed genes | ||
| Gene | Pearson's Correlation | Spearman's Correlation |
| GNG11 | -0.34 | -0.42 |
| AF347015.21 | -0.34 | -0.32 |
| AL050337.1 | -0.33 | -0.45 |
| CLEC2B | -0.31 | -0.34 |
| IFI44 | -0.31 | -0.45 |
| NSBP1 | -0.31 | -0.39 |
| NOSTRIN | -0.31 | -0.32 |
| AP002478.3 | -0.30 | -0.35 |
| AC090186.1 | -0.30 | -0.37 |
| SYCP3 | -0.30 | -0.40 |
Section V. Pathway annotation
| Pathway name | Pathway size | # SZGR 2.0 genes in pathway | Info |
|---|---|---|---|
| REACTOME MEIOSIS | 116 | 81 | All SZGR 2.0 genes in this pathway |
| REACTOME CELL CYCLE | 421 | 253 | All SZGR 2.0 genes in this pathway |
| REACTOME CHROMOSOME MAINTENANCE | 122 | 80 | All SZGR 2.0 genes in this pathway |
| REACTOME MEIOTIC SYNAPSIS | 73 | 57 | All SZGR 2.0 genes in this pathway |
| WANG ESOPHAGUS CANCER VS NORMAL UP | 121 | 72 | All SZGR 2.0 genes in this pathway |
| MATZUK SPERMATOCYTE | 72 | 55 | All SZGR 2.0 genes in this pathway |
| MEISSNER NPC HCP WITH H3 UNMETHYLATED | 536 | 296 | All SZGR 2.0 genes in this pathway |
| MEISSNER BRAIN HCP WITH H3 UNMETHYLATED | 37 | 21 | All SZGR 2.0 genes in this pathway |
| YAGI AML WITH INV 16 TRANSLOCATION | 422 | 277 | All SZGR 2.0 genes in this pathway |
| FOSTER KDM1A TARGETS DN | 211 | 119 | All SZGR 2.0 genes in this pathway |