Gene Page: USMG5
Summary ?
| GeneID | 84833 |
| Symbol | USMG5 |
| Synonyms | DAPIT|HCVFTP2|bA792D24.4 |
| Description | up-regulated during skeletal muscle growth 5 homolog (mouse) |
| Reference | MIM:615204|HGNC:HGNC:30889|Ensembl:ENSG00000173915|HPRD:18277|Vega:OTTHUMG00000018984 |
| Gene type | protein-coding |
| Map location | 10q24.33 |
| Pascal p-value | 0.003 |
| Fetal beta | -1.173 |
| eGene | Myers' cis & trans Meta |
| Support | G2Cdb.humanPSD G2Cdb.humanPSP |
Gene in Data Sources
| Gene set name | Method of gene set | Description | Info |
|---|---|---|---|
| CV:PGCnp | Genome-wide Association Study | GWAS | |
| DMG:Wockner_2014 | Genome-wide DNA methylation analysis | This dataset includes 4641 differentially methylated probes corresponding to 2929 unique genes between schizophrenia patients (n=24) and controls (n=24). | 1 |
| LK:YES | Genome-wide Association Study | This data set included 99 genes mapped to the 22 regions. The 24 leading SNPs were also included in CV:Ripke_2013 |
Section I. Genetics and epigenetics annotation
 Differentially methylated gene
| Probe | Chromosome | Position | Nearest gene | P (dis) | Beta (dis) | FDR (dis) | Study |
|---|---|---|---|---|---|---|---|
| cg04165840 | 10 | 105156204 | USMG5;PDCD11 | 4.025E-4 | -0.183 | 0.044 | DMG:Wockner_2014 |
eQTL annotation
| SNP ID | Chromosome | Position | eGene | Gene Entrez ID | pvalue | qvalue | TSS distance | eQTL type |
|---|---|---|---|---|---|---|---|---|
| rs7088711 | chr10 | 104559265 | USMG5 | 84833 | 2.538E-5 | cis | ||
| rs2482506 | chr10 | 104563742 | USMG5 | 84833 | 8.631E-7 | cis | ||
| rs4919690 | chr10 | 104616499 | USMG5 | 84833 | 0.11 | cis | ||
| rs4409766 | chr10 | 104616662 | USMG5 | 84833 | 0.1 | cis | ||
| rs3740393 | chr10 | 104636654 | USMG5 | 84833 | 0.05 | cis | ||
| rs3740390 | chr10 | 104638479 | USMG5 | 84833 | 0.08 | cis | ||
| rs12413409 | chr10 | 104719095 | USMG5 | 84833 | 0.01 | cis | ||
| rs17115419 | chr10 | 104834875 | USMG5 | 84833 | 0.07 | cis | ||
| rs11191560 | chr10 | 104869037 | USMG5 | 84833 | 0.03 | cis | ||
| rs1163249 | chr10 | 104909889 | USMG5 | 84833 | 2.722E-4 | cis | ||
| rs7913461 | chr10 | 105001324 | USMG5 | 84833 | 2.327E-10 | cis | ||
| rs1891292 | chr10 | 105001509 | USMG5 | 84833 | 1.026E-9 | cis | ||
| rs1163073 | chr10 | 105022933 | USMG5 | 84833 | 1.494E-21 | cis | ||
| rs10883855 | chr10 | 105092446 | USMG5 | 84833 | 0 | cis | ||
| rs11191686 | chr10 | 105187745 | USMG5 | 84833 | 2.788E-8 | cis | ||
| rs11191688 | chr10 | 105192569 | USMG5 | 84833 | 4.714E-5 | cis | ||
| rs7088711 | chr10 | 104559265 | USMG5 | 84833 | 0 | trans | ||
| rs2482506 | chr10 | 104563742 | USMG5 | 84833 | 1.634E-4 | trans | ||
| rs1163249 | chr10 | 104909889 | USMG5 | 84833 | 0.02 | trans | ||
| rs7913461 | chr10 | 105001324 | USMG5 | 84833 | 5.737E-8 | trans | ||
| rs1891292 | chr10 | 105001509 | USMG5 | 84833 | 2.536E-7 | trans | ||
| rs1163073 | chr10 | 105022933 | USMG5 | 84833 | 2.272E-19 | trans | ||
| rs11191686 | chr10 | 105187745 | USMG5 | 84833 | 6.526E-6 | trans | ||
| rs11191688 | chr10 | 105192569 | USMG5 | 84833 | 0.01 | trans |
Section II. Transcriptome annotation
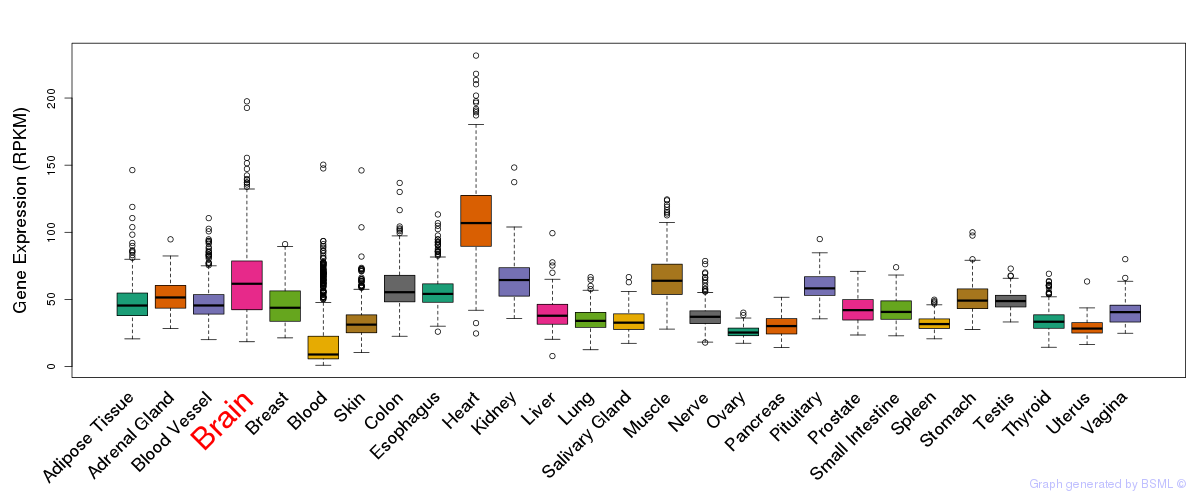
General gene expression (GTEx)
Gene expression during devlopment (BrainCloud)
Footnote:
A total of 269 time points ploted, with n=38 fetal samples (x=1:38). Each triangle represents one time point.
Gene expression of temporal and spatial changes (BrainSpan)
Footnote:
SC: sub-cortical regions; SM: sensory-motor regions; FC: frontal cortex; and TP: temporal-parietal cortex
ST1: fetal (13 - 26 postconception weeks), ST2: early infancy to late childhood (4 months to 11 years), and ST3: adolescence to adulthood (13 - 23 years)
The bar shown representes the lower 25% and upper 25% of the expression distribution.
No co-expressed genes in brain regions
Section V. Pathway annotation
| Pathway name | Pathway size | # SZGR 2.0 genes in pathway | Info |
|---|---|---|---|
| WAMUNYOKOLI OVARIAN CANCER LMP UP | 265 | 158 | All SZGR 2.0 genes in this pathway |
| WAMUNYOKOLI OVARIAN CANCER GRADES 1 2 UP | 137 | 84 | All SZGR 2.0 genes in this pathway |
| MCBRYAN PUBERTAL BREAST 6 7WK DN | 79 | 54 | All SZGR 2.0 genes in this pathway |
| LASTOWSKA NEUROBLASTOMA COPY NUMBER DN | 800 | 473 | All SZGR 2.0 genes in this pathway |
| LOPEZ MBD TARGETS | 957 | 597 | All SZGR 2.0 genes in this pathway |
| CAFFAREL RESPONSE TO THC 24HR 5 DN | 59 | 35 | All SZGR 2.0 genes in this pathway |
| ROZANOV MMP14 TARGETS UP | 266 | 171 | All SZGR 2.0 genes in this pathway |
| JIANG AGING HYPOTHALAMUS UP | 47 | 31 | All SZGR 2.0 genes in this pathway |
| KRIEG KDM3A TARGETS NOT HYPOXIA | 208 | 107 | All SZGR 2.0 genes in this pathway |