Gene Page: CCDC97
Summary ?
| GeneID | 90324 |
| Symbol | CCDC97 |
| Synonyms | - |
| Description | coiled-coil domain containing 97 |
| Reference | HGNC:HGNC:28289|Ensembl:ENSG00000142039|HPRD:14467|Vega:OTTHUMG00000182722 |
| Gene type | protein-coding |
| Map location | 19q13.2 |
| Pascal p-value | 0.077 |
| Sherlock p-value | 0.716 |
| Fetal beta | 0.484 |
| DMG | 1 (# studies) |
| eGene | Myers' cis & trans |
Gene in Data Sources
| Gene set name | Method of gene set | Description | Info |
|---|---|---|---|
| CV:PGCnp | Genome-wide Association Study | GWAS | |
| DMG:Jaffe_2016 | Genome-wide DNA methylation analysis | This dataset includes 2,104 probes/CpGs associated with SZ patients (n=108) compared to 136 controls at Bonferroni-adjusted P < 0.05. | 1 |
Section I. Genetics and epigenetics annotation
 Differentially methylated gene
| Probe | Chromosome | Position | Nearest gene | P (dis) | Beta (dis) | FDR (dis) | Study |
|---|---|---|---|---|---|---|---|
| cg01587095 | 19 | 41815869 | CCDC97 | 2.66E-10 | -0.015 | 6.4E-7 | DMG:Jaffe_2016 |
eQTL annotation
| SNP ID | Chromosome | Position | eGene | Gene Entrez ID | pvalue | qvalue | TSS distance | eQTL type |
|---|---|---|---|---|---|---|---|---|
| rs6501691 | chr17 | 72063344 | CCDC97 | 90324 | 0.18 | trans |
Section II. Transcriptome annotation
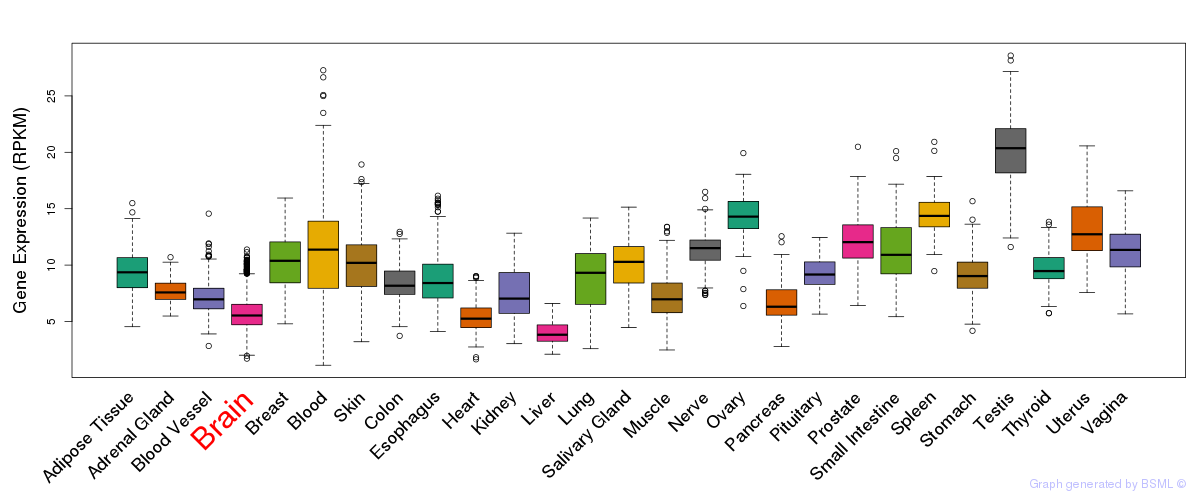
General gene expression (GTEx)
Gene expression during devlopment (BrainCloud)
Footnote:
A total of 269 time points ploted, with n=38 fetal samples (x=1:38). Each triangle represents one time point.
Gene expression of temporal and spatial changes (BrainSpan)
Footnote:
SC: sub-cortical regions; SM: sensory-motor regions; FC: frontal cortex; and TP: temporal-parietal cortex
ST1: fetal (13 - 26 postconception weeks), ST2: early infancy to late childhood (4 months to 11 years), and ST3: adolescence to adulthood (13 - 23 years)
The bar shown representes the lower 25% and upper 25% of the expression distribution.
Top co-expressed genes in brain regions
| Top 10 positively co-expressed genes | ||
| Gene | Pearson's Correlation | Spearman's Correlation |
| CPXM1 | 0.74 | 0.65 |
| HDAC7 | 0.73 | 0.67 |
| ARHGAP17 | 0.73 | 0.64 |
| LEPRE1 | 0.73 | 0.70 |
| ARAP3 | 0.72 | 0.62 |
| DVL2 | 0.72 | 0.64 |
| GUSB | 0.72 | 0.66 |
| PLEKHG4B | 0.72 | 0.64 |
| FANCA | 0.71 | 0.65 |
| TTC31 | 0.71 | 0.66 |
| Top 10 negatively co-expressed genes | ||
| Gene | Pearson's Correlation | Spearman's Correlation |
| PLA2G4A | -0.52 | -0.57 |
| HLA-C | -0.50 | -0.53 |
| AF347015.27 | -0.49 | -0.53 |
| FBXO2 | -0.49 | -0.50 |
| CA4 | -0.49 | -0.51 |
| C5orf53 | -0.49 | -0.51 |
| GBP2 | -0.48 | -0.52 |
| CD8BP | -0.48 | -0.59 |
| AF347015.31 | -0.48 | -0.52 |
| ABCG2 | -0.47 | -0.52 |
Section V. Pathway annotation
| Pathway name | Pathway size | # SZGR 2.0 genes in pathway | Info |
|---|---|---|---|
| CHARAFE BREAST CANCER LUMINAL VS MESENCHYMAL UP | 450 | 256 | All SZGR 2.0 genes in this pathway |
| FERREIRA EWINGS SARCOMA UNSTABLE VS STABLE DN | 98 | 59 | All SZGR 2.0 genes in this pathway |
| LIAO HAVE SOX4 BINDING SITES | 40 | 26 | All SZGR 2.0 genes in this pathway |
| LIAO METASTASIS | 539 | 324 | All SZGR 2.0 genes in this pathway |
| NAKAMURA METASTASIS | 47 | 28 | All SZGR 2.0 genes in this pathway |