Gene Page: NLRP12
Summary ?
| GeneID | 91662 |
| Symbol | NLRP12 |
| Synonyms | CLR19.3|FCAS2|NALP12|PAN6|PYPAF7|RNO|RNO2 |
| Description | NLR family, pyrin domain containing 12 |
| Reference | MIM:609648|HGNC:HGNC:22938|Ensembl:ENSG00000142405|HPRD:14803|Vega:OTTHUMG00000060776 |
| Gene type | protein-coding |
| Map location | 19q13.42 |
| Pascal p-value | 0.841 |
| Fetal beta | -0.414 |
| DMG | 1 (# studies) |
| eGene | Meta |
Gene in Data Sources
| Gene set name | Method of gene set | Description | Info |
|---|---|---|---|
| CV:PGCnp | Genome-wide Association Study | GWAS | |
| DMG:Wockner_2014 | Genome-wide DNA methylation analysis | This dataset includes 4641 differentially methylated probes corresponding to 2929 unique genes between schizophrenia patients (n=24) and controls (n=24). | 1 |
| DNM:Ambalavanan_2016 | Whole Exome Sequencing | This dataset includes 20 de novo mutations detected in 17 COS probands. |
Section I. Genetics and epigenetics annotation
 DNM table
| Gene | Chromosome | Position | Ref | Alt | Transcript | AA change | Mutation type | Sift | CG46 | Trait | Study |
|---|---|---|---|---|---|---|---|---|---|---|---|
| NLRP12 | chr19 | 54314055 | G | C | NM_001277126 | p.(=) | synonymous SNV | Childhood-onset schizophrenia | DNM:Ambalavanan_2016 |
Differentially methylated gene
| Probe | Chromosome | Position | Nearest gene | P (dis) | Beta (dis) | FDR (dis) | Study |
|---|---|---|---|---|---|---|---|
| cg08703289 | 19 | 54328302 | NLRP12 | 1.123E-4 | 0.25 | 0.029 | DMG:Wockner_2014 |
Section II. Transcriptome annotation
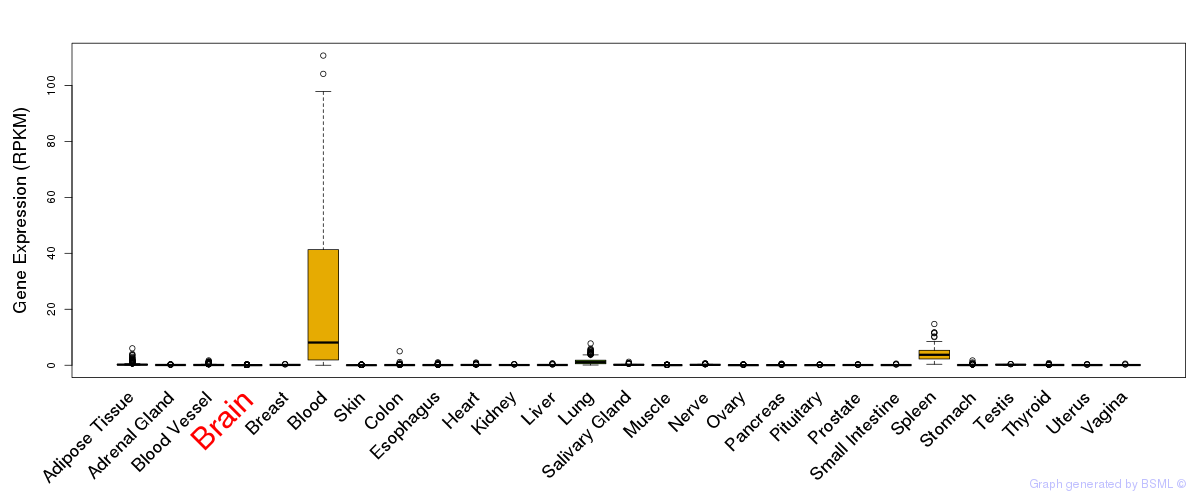
General gene expression (GTEx)
Gene expression during devlopment (BrainCloud)
Footnote:
A total of 269 time points ploted, with n=38 fetal samples (x=1:38). Each triangle represents one time point.
Gene expression of temporal and spatial changes (BrainSpan)
Footnote:
SC: sub-cortical regions; SM: sensory-motor regions; FC: frontal cortex; and TP: temporal-parietal cortex
ST1: fetal (13 - 26 postconception weeks), ST2: early infancy to late childhood (4 months to 11 years), and ST3: adolescence to adulthood (13 - 23 years)
The bar shown representes the lower 25% and upper 25% of the expression distribution.
No co-expressed genes in brain regions
Section V. Pathway annotation
| Pathway name | Pathway size | # SZGR 2.0 genes in pathway | Info |
|---|---|---|---|
| OHGUCHI LIVER HNF4A TARGETS DN | 149 | 85 | All SZGR 2.0 genes in this pathway |
| ZWANG TRANSIENTLY UP BY 2ND EGF PULSE ONLY | 1725 | 838 | All SZGR 2.0 genes in this pathway |