Gene Page: RFT1
Summary ?
| GeneID | 91869 |
| Symbol | RFT1 |
| Synonyms | CDG1N |
| Description | RFT1 homolog |
| Reference | MIM:611908|HGNC:HGNC:30220|Ensembl:ENSG00000163933|HPRD:15239|Vega:OTTHUMG00000074035 |
| Gene type | protein-coding |
| Map location | 3p21.1 |
| Pascal p-value | 1.998E-4 |
| Fetal beta | -0.445 |
| DMG | 1 (# studies) |
| eGene | Caudate basal ganglia Cerebellar Hemisphere Cerebellum Cortex Frontal Cortex BA9 Nucleus accumbens basal ganglia Putamen basal ganglia Myers' cis & trans |
Gene in Data Sources
| Gene set name | Method of gene set | Description | Info |
|---|---|---|---|
| CV:PGCnp | Genome-wide Association Study | GWAS | |
| DMG:Jaffe_2016 | Genome-wide DNA methylation analysis | This dataset includes 2,104 probes/CpGs associated with SZ patients (n=108) compared to 136 controls at Bonferroni-adjusted P < 0.05. | 1 |
| LK:YES | Genome-wide Association Study | This data set included 99 genes mapped to the 22 regions. The 24 leading SNPs were also included in CV:Ripke_2013 |
Section I. Genetics and epigenetics annotation
 Differentially methylated gene
| Probe | Chromosome | Position | Nearest gene | P (dis) | Beta (dis) | FDR (dis) | Study |
|---|---|---|---|---|---|---|---|
| cg21627574 | 3 | 53164588 | RFT1 | 1.3E-9 | -0.015 | 1.35E-6 | DMG:Jaffe_2016 |
eQTL annotation
| SNP ID | Chromosome | Position | eGene | Gene Entrez ID | pvalue | qvalue | TSS distance | eQTL type |
|---|---|---|---|---|---|---|---|---|
| rs10994209 | chr10 | 61877705 | RFT1 | 91869 | 0.06 | trans | ||
| rs2564924 | 3 | 53103155 | RFT1 | ENSG00000163933.5 | 4.421E-7 | 0.01 | 61323 | gtex_brain_putamen_basal |
| rs2564923 | 3 | 53103262 | RFT1 | ENSG00000163933.5 | 2.423E-7 | 0.01 | 61216 | gtex_brain_putamen_basal |
| rs34530577 | 3 | 53103796 | RFT1 | ENSG00000163933.5 | 5.907E-7 | 0.01 | 60682 | gtex_brain_putamen_basal |
| rs34597126 | 3 | 53104407 | RFT1 | ENSG00000163933.5 | 4.443E-7 | 0.01 | 60071 | gtex_brain_putamen_basal |
| rs2336723 | 3 | 53106047 | RFT1 | ENSG00000163933.5 | 1.301E-6 | 0.01 | 58431 | gtex_brain_putamen_basal |
| rs2564940 | 3 | 53107569 | RFT1 | ENSG00000163933.5 | 5.328E-7 | 0.01 | 56909 | gtex_brain_putamen_basal |
| rs2581800 | 3 | 53109352 | RFT1 | ENSG00000163933.5 | 4.972E-7 | 0.01 | 55126 | gtex_brain_putamen_basal |
| rs1864367 | 3 | 53111704 | RFT1 | ENSG00000163933.5 | 2.372E-7 | 0.01 | 52774 | gtex_brain_putamen_basal |
| rs2253209 | 3 | 53115160 | RFT1 | ENSG00000163933.5 | 5.737E-7 | 0.01 | 49318 | gtex_brain_putamen_basal |
| rs2336725 | 3 | 53118739 | RFT1 | ENSG00000163933.5 | 5.737E-7 | 0.01 | 45739 | gtex_brain_putamen_basal |
| rs2253685 | 3 | 53119703 | RFT1 | ENSG00000163933.5 | 5.737E-7 | 0.01 | 44775 | gtex_brain_putamen_basal |
| rs2253796 | 3 | 53120098 | RFT1 | ENSG00000163933.5 | 5.737E-7 | 0.01 | 44380 | gtex_brain_putamen_basal |
| rs11130338 | 3 | 53120924 | RFT1 | ENSG00000163933.5 | 5.737E-7 | 0.01 | 43554 | gtex_brain_putamen_basal |
| rs4687701 | 3 | 53121276 | RFT1 | ENSG00000163933.5 | 5.735E-7 | 0.01 | 43202 | gtex_brain_putamen_basal |
| rs2581782 | 3 | 53122257 | RFT1 | ENSG00000163933.5 | 1.746E-7 | 0.01 | 42221 | gtex_brain_putamen_basal |
| rs2581783 | 3 | 53122258 | RFT1 | ENSG00000163933.5 | 1.743E-7 | 0.01 | 42220 | gtex_brain_putamen_basal |
| rs2581784 | 3 | 53122370 | RFT1 | ENSG00000163933.5 | 5.737E-7 | 0.01 | 42108 | gtex_brain_putamen_basal |
| rs2082093 | 3 | 53122969 | RFT1 | ENSG00000163933.5 | 4.975E-7 | 0.01 | 41509 | gtex_brain_putamen_basal |
| rs891368 | 3 | 53123273 | RFT1 | ENSG00000163933.5 | 5.737E-7 | 0.01 | 41205 | gtex_brain_putamen_basal |
| rs1078968 | 3 | 53123486 | RFT1 | ENSG00000163933.5 | 5.737E-7 | 0.01 | 40992 | gtex_brain_putamen_basal |
| rs2564921 | 3 | 53125585 | RFT1 | ENSG00000163933.5 | 1.553E-6 | 0.01 | 38893 | gtex_brain_putamen_basal |
| rs11242 | 3 | 53125922 | RFT1 | ENSG00000163933.5 | 5.737E-7 | 0.01 | 38556 | gtex_brain_putamen_basal |
| rs2581786 | 3 | 53126143 | RFT1 | ENSG00000163933.5 | 5.789E-7 | 0.01 | 38335 | gtex_brain_putamen_basal |
| rs397773232 | 3 | 53127135 | RFT1 | ENSG00000163933.5 | 6.048E-7 | 0.01 | 37343 | gtex_brain_putamen_basal |
| rs2581787 | 3 | 53127677 | RFT1 | ENSG00000163933.5 | 1.009E-6 | 0.01 | 36801 | gtex_brain_putamen_basal |
| rs7640294 | 3 | 53130913 | RFT1 | ENSG00000163933.5 | 9.117E-7 | 0.01 | 33565 | gtex_brain_putamen_basal |
| rs2163167 | 3 | 53131772 | RFT1 | ENSG00000163933.5 | 1.473E-6 | 0.01 | 32706 | gtex_brain_putamen_basal |
| rs2115781 | 3 | 53131829 | RFT1 | ENSG00000163933.5 | 4.545E-7 | 0.01 | 32649 | gtex_brain_putamen_basal |
| rs2115782 | 3 | 53131830 | RFT1 | ENSG00000163933.5 | 4.877E-7 | 0.01 | 32648 | gtex_brain_putamen_basal |
Section II. Transcriptome annotation
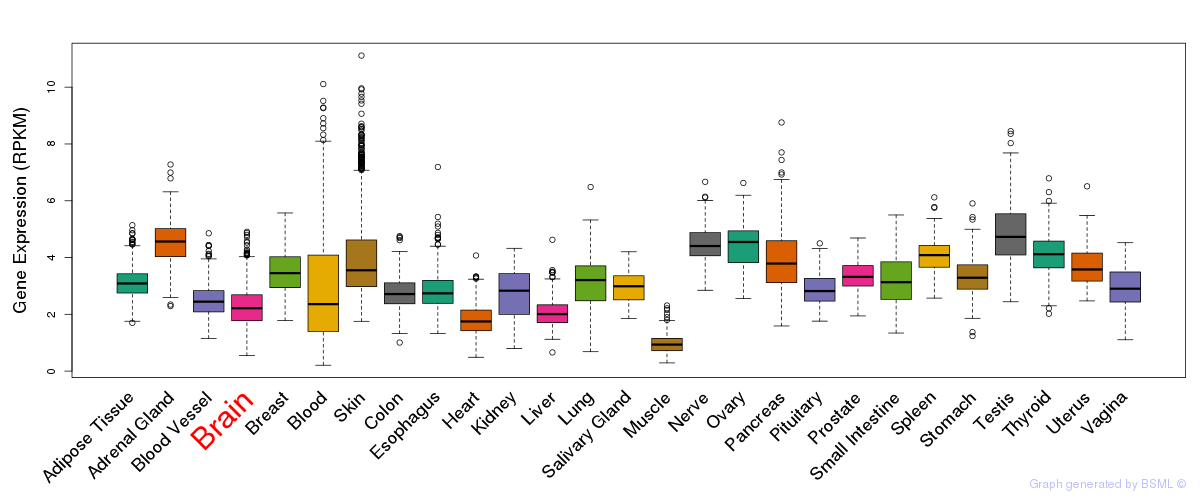
General gene expression (GTEx)
Gene expression during devlopment (BrainCloud)
Footnote:
A total of 269 time points ploted, with n=38 fetal samples (x=1:38). Each triangle represents one time point.
Gene expression of temporal and spatial changes (BrainSpan)
Footnote:
SC: sub-cortical regions; SM: sensory-motor regions; FC: frontal cortex; and TP: temporal-parietal cortex
ST1: fetal (13 - 26 postconception weeks), ST2: early infancy to late childhood (4 months to 11 years), and ST3: adolescence to adulthood (13 - 23 years)
The bar shown representes the lower 25% and upper 25% of the expression distribution.
No co-expressed genes in brain regions
Section V. Pathway annotation
| Pathway name | Pathway size | # SZGR 2.0 genes in pathway | Info |
|---|---|---|---|
| KEGG N GLYCAN BIOSYNTHESIS | 46 | 31 | All SZGR 2.0 genes in this pathway |
| REACTOME METABOLISM OF PROTEINS | 518 | 242 | All SZGR 2.0 genes in this pathway |
| REACTOME POST TRANSLATIONAL PROTEIN MODIFICATION | 188 | 116 | All SZGR 2.0 genes in this pathway |
| REACTOME ASPARAGINE N LINKED GLYCOSYLATION | 81 | 54 | All SZGR 2.0 genes in this pathway |
| REACTOME BIOSYNTHESIS OF THE N GLYCAN PRECURSOR DOLICHOL LIPID LINKED OLIGOSACCHARIDE LLO AND TRANSFER TO A NASCENT PROTEIN | 29 | 17 | All SZGR 2.0 genes in this pathway |
| WEI MYCN TARGETS WITH E BOX | 795 | 478 | All SZGR 2.0 genes in this pathway |
| WANG RESPONSE TO GSK3 INHIBITOR SB216763 UP | 397 | 206 | All SZGR 2.0 genes in this pathway |